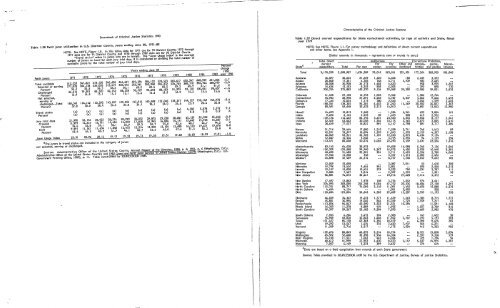
--------------------------------------------------------------.---------!I,Characterl~tlcs<strong>of</strong> the Crlminol <strong>Justice</strong> Systems<strong>Sourcebook</strong> <strong>of</strong> <strong>Criminal</strong> <strong>Justice</strong> <strong>Statistics</strong> <strong>1983</strong>Ta~~~rl.13;79Dlrectcurrent expenditures for State correctional activities, by type <strong>of</strong> activity and State, fiscal.Table 1.38 Petit juror utilization In U.S. District Courts, years ending June 30, 1971-82!'OTE: See !'OTE, Figure 1.8. In this table, data for 1971 are for 93 District Courts; 1972 through1977 data are for 9', District Courts; and 1978 through 1982 data are for 95 District Courts."Travel stu,vs" refers to Jurors who are In transit. The "Juror Usage Index" Is the averagenumber <strong>of</strong> jurors on hand for each jury trial day; It Is calculated by dividing the total ntxnber <strong>of</strong>available jurors by the total number <strong>of</strong> Jury trial days.Years ending June 30Petit jurors 1971 1972 1973 1974 1975 1976 1977 1978 1979 1980Total available 512,553 547,821 573,150 540,628 546,627 592,594 584,122 570,523 565,617 605,547Selected or serving 277,878 304,178 324,038 315,419 328,445 356,%1 352,940 345,372 334,765 368,710Percent 54.2 55.5 56.5 58.3 60.1 60.2 60.4 60.5 59.2 60.9Challenged 66,314 79,501 86,520 82,152 88,228 92,727 90,693 88,103 91,575 92,110Percent 12.9 14.5 15.1 15.2 16.1 15.6 15.5 15.5 16.2 15.2N:>t selected,serving orchallenged--Total 168,361 164,142 162,592 143,057 129,954 142,916 140,489 137,048 139,277 144,727Percent 32.8 30.0 28.4 26.5 23.8 24.1 24.1 24.0 24.6 23.9Travel status (a) (a) (a) (a) (a) (a) (a) (a) (a) 4,582Percent (a) (a) (a) (a) (a) (a) (a) (a) (a) 0.8Jury trial days 21,990 26,176 28,425 28,274 28,293 30,032 29,875 29,238 28,851 32,159<strong>Criminal</strong> 11,999 14,615 16,791 16,426 15,818 17,818 16,945 16,084 15,171 15,649Percent 54.6 55.8 59.1 58.1 55.9 59.3 56.7 55.0 52.6 48.7Civil 9,991 11,561 11,634 11,848 12,475 12,214 12,930 13,154 13,680 16,510Percent 45.4 44.2 40.9 41.9 44.1 40.7 43.3 45.0 47.4 51.3Juror Usage Index 23.31 20.96 20.16 19.12 19.32 19.73 19.55 19.51 19.60 18.83Percentchange19821981 1982 over 1981648,n9 631,606 -2.7396,746 388,979 -2.061.1 61.6 X100,041 98,657 -1.415.4 15.6 X152,142 143,970 -5.423.4 22.8 X5,078 5,572 9.70.8 0.9 X35,596 35,263 -0.915,925 15,587 -2.144.7 44.2 X19,671 19,676 0.055.3 55.8 X18.23 17.91 -1.8aThe jurors in travel status are included in the category <strong>of</strong> jurorsnot selected, serving or challenged.Source: Administrative Office <strong>of</strong> the United States Courts, Annual Re~rt <strong>of</strong> the Director, 1980 p. 6; 1981, p. 6 (Washington, D.C.:Administrative Office <strong>of</strong> the thlted States Courts>; and 1982 Grand and Petit juror ervice In Lhlted States Drstrlct c'ii'iirts (Washington, D.C.: U.S.Government Printing Office, <strong>1983</strong>), p. 11. Table constructed by ~BOO< staff.t'II!IIi~PIIIiii~,iq~~~liNJJ~ ~~he~:~:I;~!e ~~~n~f; i~rvey methodology and definitions <strong>of</strong> direct current expenditures(Dollar amounts !n thousands. - represents 7.ero or rounds to zero.)Total direct lo:;ili\.1tloo~ Corrections Probation,State a current For For Other and admlnls- parole MlscelexeendltureTotal For men women Juveniles combined tratlon and pard~n laneousTotal 3,170,250 2,500,987 1,624,389 92,016 563,561 221,021 177,264 385,959 106,040Alabama 36,097 30,065 21,659 1,620 6,606 180 2,439 3,593Alaska 20,868 17 ,201 4,783 768 5,711 5,939 982 2,685Arizona 38,038 30,908 24,773 1,482 4,653958 3,925 2,247Arkansas 16,636 15,183 8,353 805 6,025 393 890 170California336,764 275,882 162,370 9,134 79,069 25,309 17,985 39,021 3,!I76Colorado 41,430 27,100 16,733 1,005 9,362 1,586 12,744Connecticut 55,983 38,998 27,891 2,483 5,787 2,837 3,866 9,666 3,453DelawGle 17,335 10,035 7,115 380 2,5403,056 1,599 2,645Florida 188,541 138,305 96,381 6,455 21,200 14,269 20,902 26,027 3,307Georgia 80,491 49,648 32,622 2,213 14,813 5,801 12,062 12,980Hawaii 14,693 10,813 2,268 1,584 6,961 655 3,064 161Idaho 9,69U 6,145 3,555 89 1,693 808 613 2,932I Hinols139,126 116,402 86,196 3,631 23,530 3,045 9,056 8,127 5,541Indiana 52,429 43,062 30,058 1,564 10,175 3,265 2,872 2,Oll5 2,410Iowa 38,6/!9 :l1),~57 18,82( 891 6,147 4,798 891 3,717 3.384Kansas 31,716 29,464 17,880 1,31-5 7,558 2,711 740 1,413 99Kentucky 42,291 33:,67.7 18,894 1,353 II ,810 1,570 2,129 4,337 2,198Louisiana 66,049 52,2dl 36,785 1,181 12,240 2,075 4,634 9,134Maine 12,087 10,536 3,8563,725 2,955 96 1,159 296Maryland 113,/~71 80,608 50,674 2,085 22,290 5,559 3,031 22,556 7,276Massachusetts 82,145 64,628 28,932 19,608 16,088 5,345 7,126 5,046Mi-:hlgan 156,329 125,588 99,940 4,267 16,975 4,406 5,920 16,440 8,381Minnesota 40,690 31,488 22,301 981 5,711 2,495 2,356 2,780 4,066Mississippi 19,906 15,208 3583,337 11,513 2,202 2,4%Missouri 45,898 32,489 22,5148,727 1,248 3,652 9,652 105Montana 12,069 10,098 3,087 7,011 53 1,610 308Nebraska 19,796 13,426 9,644 981 2,801 590 2,568 3,212Nevada 19,157 15,028 10,431 579 3,222 796 1,231 2,787 IIINew I-bmpshire 9,084 7,4137 3,814 2,397 1,276 1,561 36New Jersey 86,801 74,075 36,441 10,214 27,420 7,414 5,312New W.exica 17,497 12,882 7,978 lOB 3,754 1,042 974 3,641New York 334,995 283,880 2:06,748 9,064 47,732 20,336 18,686 27,138 5,291N:>rth Carolina 115,761 88,7"7 74,096 2,118 11,091 1,442 5,650 15,088 6,276N:>rth Dakota 4,664 4,1061,501 2,605 558Ohio 120,684 103,004 56,643 4,385 29,689 12,287 5,959 11,193 528Oklahoma 46,039 34,362 19,623 1,517 11.659 1,563 1,385 8,715 1,577Oregon 45,831 36,994 19,066 866 15,339 1,723 1,559 7,21 I 67Pennsylvania 113,826 96,067 60,590 3,332 21,551 10,594 11,591 6,168Rhode Island 16,360 11,278 8,889 454 1,9351,557 2,709 816South Carolina 49,397 39,267 22,185 9,204 7,8763,669 5,985 476South Dakoto 7,903 6,284 3,672 224 2,388167 1,422 30Tennessee 55,909 49,020 32,843 1,448 11,942 2,787 1,193 5,193 503Texas101,427 85,158 62,383 4,296 18,4796,390 9,674 205Utah 19,292 12,567 1,634 376 2,620 7,937 454 6,271Vermont 11,369 5,716 3,517 1,175 1,024 415 4,333 905Virginia 109,676 80,843 66,895 3,214 10,734 8,721 15,05& 5,054Washlngto;~ 65,592 52,688 33,398 2,956 16,3342,597 9,na 579West Virginia 14,100 I I ,521 7,002 463 4,056729 1,794 56Wisconsin 68,612 41,999 27,952 2,430 8,470 3,147 5,437 14,975 6,201WyorrJng 7,057 6,169 3,233 299 2,637 274 614a Data are based on a field compilation from records <strong>of</strong> each State government.Source: Table provided to 5O..RCEBOO< s taff b y th e US •• DEportment <strong>of</strong> <strong>Justice</strong>, <strong>Bureau</strong> <strong>of</strong> <strong>Justice</strong> <strong>Statistics</strong>.{},., .
'<strong>Sourcebook</strong> <strong>of</strong> <strong>Criminal</strong> <strong>Justice</strong> <strong>Statistics</strong> <strong>1983</strong>Table 1.40 Employment and payroll for State and local carrectional activities, by State and level <strong>of</strong> government, October 1971-October1979State andlevel <strong>of</strong> governmentStates-local, totalStatesLocal, totalCountiesMunicipalitiesAlabamoStateLocal, totalCountiesMunicipalitiesAlaskaStateLocal, totalBoroughsMunicipalitiesArizal.aStateLocal, totalCountiesMUnicipalitiesArkansasStateLocal, totalCountiesMunicipalitiesCaliforniaStateLocal, totalCountiesMunicipalitiesColoradoStateLocal, totalCountiesMunicipalitiesConnecticutStateLocal, totalMunicipalitiesDelawareStateLocal, totalCountiesMunicipalitiesNJTE: See NJTE, Figure 1.1. For data required to compute percentages based ontotal criminal justice full-time equivalent employees and total criminal justicepayroll, see Table 1.8. For survey methodology and definitions <strong>of</strong> terms, se~Appendix I.(Dollar amounts in thousands. - represents or rounds f6 zero.)Employment and payroll aOctober 1971Full-timeOctober 1972Full-timeOctober 1973Full-timeOctober 1974Full-timeequivalent October equivalent October equivalent October ~quivalent Octoberemployment payroll employment payroll employment payroll employment payroll172,821106,04566,77649,26117,5151,42593948633315338033545451,374745629576536654522131575626,75410,15916,59515,8027931,7101,3273831482352,0582,0481010583583$129,11978,64850,47036,021l14,442730486244163814013643737881512;)693343531321598653325,2669,92515,34214,5437991,2651,012253761771,6601,65466493493177,864107,78570,07953,01417,0651,5901,00358741417344237072721,450744706649577615432181655329,03911,89117,14816,3108381,7781,3993791612182,0872,087690690$142,9051l6,71056,19340,95815,2358925633302349555947683831,0205394814374440530699673228,32911,68716,64315,1l068361,3601,101259871721,8061,806565565187,298112,17675,12256,90518,2171,7631,06669753616138534144441,845950895847488215602611768529,58911,71417,87517,0947811,9101,4704402172232,3122,312654654$159,51895,56563,95346,74217,2111,1036954093199040336043431,40376164260141479348132805131,03912,69118,34817,5288201,6011,2683331312021,9071,907522522203,230121,16082,07062,48219,5882,0361,24379362017344541233332,0991,0701,0291,013168926432491975231,99612,80719,18918,3218682,0531,5355182802382,7032,7012261:33683$185,577110,71074,86755,02719,8401,39385054441113257153437371,811943868856135614201411073435,76814,91320,85519,9638921,8841,41134411842582,5422,53933637637October 1275Full-timeequivalent Octoberemployment pam!.lL213,813126,93386,88067,94218,9382,1711,28189073615445542431312,2371,1031,1341,115191,1487923562837332,57212,70419,86819,0148542,3311,7026293532762,5932,593791791$208,942123,;!5285,/.9064,1171:32I,:~131,15761,104263450812570166733332, Ito1,0751,0351,018177665602061574939,91416,01723,89622,9389592,4531,8965562642922,4462,446760760!'\/1jlI:I:!Characteristics <strong>of</strong> the Criminai <strong>Justice</strong> SystemsEmployment and pgyrpllaOctober /976 October 19i'7 October 19Z11 October 1979Full-time Full-time Full-time Full-timeequivalent October equivalent October equivalent October equivalent b October_em--,-p_lo..;.yrne __ nt_...:po--,-y_ro_I_1 _e_mc:.p.;..lo..:.yrne...;..:..:.;n.:.;t......:PD=y.:.;ro:.:I.:.;1--.:em=p:;;lo:.!yrne=:.:nt:... .. -"pa~yr..:o.:.:.II_.;:em::.:.:!:p""lo"-yrne=n.:.:.t'-..J:pa:.:L:yrc::o~1I227,576134,42093,15673,79619,3602,3711,48288974314653349340402,6291,2001,4291,31l1481,2798134663808634,24012,59021,65020,7129382,4741,8026724102622,5382,53355831831$235,952137,92898,02474,27023,753!,9731,271703571:312486281449492,6241,2031,4211,377448835972862275944,35616,83227,52426,31l71,1372,8022,1566463472992,4512,44655844844243,248145,55297,69677,61:3220,0142,6271,5831,04488416058754641412,8661,4351,4311,376551,6361,1374994118833,74913,30420,44519,5109352,2811,5447374512862,8432,83855872872$271,645163,079108,56682,01:3726,4792,4581,5998597101501,00694857573,1201,6191,5011,451491,/448193242626347,64320,49327,15026,0001,1502,7702,0347364093283,1163,11066904904253,448151,408102,04081,01521,0253,2761,8831,3931,16722652249626263,1781,6941,4841,452321,3968795174281:3932,02412,49019,53418,6299052,91/2,0019105923182,6692,66455944944$297,367179,654117,71390,29027,4233,3622,0971,2661,05021693390231313,5731,8591,7141,676381,1728033692977247,41~20,09027,32926,1431,1863,7212,7819405513893,1913,185661,0041,004264,363160,778103,68382,12021,6213,1281,8691,26198028155851939393,5372,0231,5131,480341,/651,0985714789432,64912,75319,90518,9949102,6751,6471,0296983322,6312,6221091,0481,048$332,250202,562129,6a997,64832,0403,3912,1901,2029192831,0851,03253534,0242,2881,7361,695411,4551,0294263458153,25823,39629,86228,5351,3273,6952,5711,1246924323,2863,27710101,1331,133-------_.-. - .~District <strong>of</strong> Columbia:Local, totalFloridaStateLocal, totalCountiesMunicipalitiesGeorgiaStateLocal, totalCountiesMunicipalitiesHawaiiStateLocal, totalCountiesMunicipalities2,6257,3674,6982,6692,0376323,8%2,5031,3931,2141794343587617592,3904,5723,0191,5531,1883652,1641,4127526491034003376213492,8508,4725,8312,6412,0316104,0502,5931,4571,2691884323518117642,9175,6744,0371,6371,2563812,5611,73682471710838432064II532,9229,8277,0652,7622,2195434,9703,1831,7C71,5482394443608420642,8837,1165,1571,9591,6033573,2942,1701,1249781454503717918613,33310,8168,2742,5421,9995435,3153,4271,8881,6622264533726117643,4869,0587,0352,0241,6154093,8672,5661,3011,1511504944128212692,741II ,8619,0222,8392,2685715,6953,6372,0581,753305380371993,7669,3626,9852,3771,9374404,1582,7131,4451,222223454446882,93213,0239,8123,2112,3728396,1643,9492,2151,88932663759740404,00011,2748,4232,8512,1666854,9993,3241,6751,42425278874047472,87813,1899,8853,3042,6456596,5764,3942,1821,86431865061139394,59413,0039,8493,1532,~;~5,4943,7421,7521,49825475170249492,92213,71610,3/03,4062,8225846,6974,5052,1921,80239062858345455,43714,20910,7423,4672,8755916,9174,9761,94/1,59834384578461612,81114,49210,9433,5502,9965547,2555,1102,1521,85829473568451514,37216,60512,7533,8523,2286247,8565,8781,9781,6952839428826060See footnotes at end <strong>of</strong> table.110
- Page 1 and 2:
u.s. Department of JusticeBureau of
- Page 3 and 4:
________ n~'·••SOURCEBOOKOF CR
- Page 5 and 6:
Sourcebook of Criminal Justice Stat
- Page 7 and 8:
Figure B An overview of detelnclude
- Page 9 and 10:
--------- - --Svurcebook of Crimina
- Page 11 and 12:
- - .. "-- - ~------~ ------------C
- Page 13 and 14:
Figure3.12 Estimated rate (per 100,
- Page 15 and 16:
TableFig. 2.6 Respondents taking pr
- Page 17 and 18:
Sourcebook of Criminal Justice Stat
- Page 19 and 20:
---------- - -- ~------------------
- Page 21 and 22:
- ...... - ~r---~---------~--------
- Page 24 and 25:
------------- - ~------~-----~-----
- Page 26 and 27: Sourcebook of Criminal Justice Stat
- Page 28 and 29: --------- -' -- - -'-- ----~-------
- Page 30 and 31: ---- -- --~------~ ---rl.Sourcebook
- Page 32 and 33: ~~---------- ---~----------~-------
- Page 34 and 35: -------------- - ---~---~--------~-
- Page 36 and 37: ~~~~~~~---- - -- -Sourcebook of Cri
- Page 38 and 39: ----.... ....--.-. ~"'-.~Sourcebook
- Page 40 and 41: (Sourcebook of Criminal Justice Sta
- Page 42 and 43: -----~---------------------.-'-----
- Page 44 and 45: Table 1.13 Number and rateOct. 31,
- Page 46 and 47: ~-~- ~-...--~ -- ~ ---,~-------. -.
- Page 48 and 49: -- ..... -,-.--..-... ~~----r; __ '
- Page 50 and 51: ---..0lIl, - -~,..--- -- - - ----~-
- Page 52 and 53: -----------------------------------
- Page 54 and 55: .~------~--------------------------
- Page 56 and 57: "Sourcebook of Criminal Justice Sta
- Page 58 and 59: ------------ - -- -"\I'Sourcebook o
- Page 60 and 61: Sourcebook of Criminal Justice Stat
- Page 62 and 63: Sourcebook of Criminal Justice Stat
- Page 65 and 66: ---- ~------~--~- -..---Sourcebook
- Page 67 and 68: Sourcebook of Criminal Justice Stat
- Page 69 and 70: .~f'ISourcebook of Criminal Justice
- Page 71 and 72: Characteristics of the Criminal Jus
- Page 73 and 74: f'Sourcebook of Criminal Justice St
- Page 75: --'~--~---------------_..."'.".,..,
- Page 79 and 80: ------ ~---~-----~-----~Sourcebook
- Page 81 and 82: -----------~-~---~-------Sourcebook
- Page 83 and 84: -----~---~~~. -'""".-=-./}Character
- Page 85 and 86: --------------------Sourcebook of C
- Page 87 and 88: -----------------------------------
- Page 89 and 90: [!r-·ISourcebook of Criminal Justi
- Page 91 and 92: - _. - -------~--...;--~"-"----- --
- Page 93 and 94: .~. ---..ot--~.....--- -- ~------_.
- Page 95 and 96: Sourcebook of Criminal Justice Stat
- Page 97 and 98: --""'1,- ~,.--- --_'M~II!tlT'-~'r.
- Page 99 and 100: - -~--~--~-~~-------~----------Tabl
- Page 101 and 102: ~~--~~--~-----~ ----Sourcebook of C
- Page 103 and 104: ~-~-------------------------_--____
- Page 105 and 106: ------------Sourcebook of Criminal
- Page 107 and 108: Sourcebook of Criminal Justice Stat
- Page 109 and 110: Characteristics of the Criminal Jus
- Page 111 and 112: ------- -- - -- -Sourcebook of Crim
- Page 113 and 114: "Sourcebook of Criminal Justice Sta
- Page 115 and 116: Sourcebook of Criminal Justice Stat
- Page 117 and 118: ------"'--~ ,'~- =--Sourcebook of C
- Page 119 and 120: Sourcebook of Criminal Justice S;at
- Page 121 and 122: ,,iSourcebook of Criminal Justice S
- Page 123 and 124: Source: George H. Gallup, The Gallu
- Page 125 and 126: ----~------~~--~----------~--------
- Page 127 and 128:
Sourcebook of Criminal Justice Stat
- Page 129 and 130:
--------------Sourcebook of Crimina
- Page 131 and 132:
--~-~~~~---------'---Public Attitud
- Page 133 and 134:
---------------------Sourcebook of
- Page 135 and 136:
-----------------------------------
- Page 137 and 138:
----------- --~-_.------~---t]Sourc
- Page 139 and 140:
Sourcebook of Criminal Justice Stat
- Page 141 and 142:
234Sourcebook of Criminal Justice S
- Page 143 and 144:
Sourcebook of Criminal Justice Stat
- Page 145 and 146:
~---.-.-.~~~ .. ~.Sourcebook of Cri
- Page 147 and 148:
,~--------~---------------~--------
- Page 149 and 150:
-~---------i': 1r\ jI~1 Public Atti
- Page 151 and 152:
--~---------------~----------Source
- Page 153 and 154:
~-~ - -'--~-------~----~~----------
- Page 155 and 156:
~-~- ~-----------------------------
- Page 157 and 158:
· -.Figure 2.14 Attitudes toward t
- Page 159 and 160:
Sourcebook of Criminal Justice Stat
- Page 161 and 162:
Sourcebook of Criminal Justice Stat
- Page 163 and 164:
--"'" - -~--..--- -Sourcebook of Cr
- Page 166 and 167:
.,.----------- - --" ,,jSourcebook
- Page 168 and 169:
~---~----~---" '--Sourcebook of Cri
- Page 170 and 171:
Sourcebook of Criminal Justice Stat
- Page 172 and 173:
....... ,-"'-~--... ~.Sourcebook of
- Page 174 and 175:
-- ..... --~.....-- -- -~ --'\,j--S
- Page 176 and 177:
"~Sourcebook of Criminal Justice St
- Page 178 and 179:
--~----- --~-----r\ I,I.-------. "
- Page 180 and 181:
---------------------,-------------
- Page 182 and 183:
Sourcebook of Criminal Justice Stat
- Page 184 and 185:
--------------------_.;e __ ... , .
- Page 186 and 187:
-----_.----------------------------
- Page 188 and 189:
--~--~-...---Sourcebook of Criminal
- Page 190 and 191:
----....--,-"..__._-..- ~ -- ~~ ...
- Page 192 and 193:
-- ..... -~-..---=4'CI)("")CI)9:::s
- Page 194 and 195:
-~-~ -----------------Sourcebook of
- Page 196 and 197:
Nature and Distribution of Known Of
- Page 198 and 199:
--------.-~ '-'=~~-------- -- -I1Na
- Page 200 and 201:
Nature and Distribution of Known Of
- Page 202 and 203:
---------~----------------~--------
- Page 204 and 205:
-------'''*'''_''' __ ,~=IW".(ISour
- Page 206 and 207:
;1INoture ond Distribution of /
- Page 208 and 209:
~~~-~----- ---- -~---~---~--~~-----
- Page 210 and 211:
Sourcebook of Criminol Justice Stat
- Page 212 and 213:
~ ---~ ---------- - ---Sout!:eboci<
- Page 214 and 215:
- ~--J."'~~~"_~ ..~F'"-_ ....Source
- Page 216 and 217:
Nature and Distribution of Known Of
- Page 218 and 219:
--------"Source bo 0 k of Crimi no
- Page 220 and 221:
Sourcebook of Criminol Justice Stat
- Page 222 and 223:
"---- ~ -------~~ -----------------
- Page 224 and 225:
.------~~- --~Sourcebook of Crimina
- Page 226 and 227:
396----------- -- ~Sourcebook of Cr
- Page 228 and 229:
Sourcebook of Criminal Justice Stat
- Page 230 and 231:
--Agure 3.24 Rate (per 100 officers
- Page 232 and 233:
407-~------- ----Sourcebook of Crim
- Page 234 and 235:
------------- -- ~Sourcebook of Cri
- Page 236 and 237:
Characteristics and Distribution of
- Page 238 and 239:
---.0lIl, - ~-.,---------- . ---Sou
- Page 240 and 241:
--~----~c,Sourcebook of Criminal Ju
- Page 242 and 243:
------------ - -- ----- --------~II
- Page 244 and 245:
- ----~--~\"r--. 'I[I)1Ir ri II.~\,
- Page 246 and 247:
.~--,..., - -~ --..--- --~ ----~---
- Page 248 and 249:
-------_ .. -Sourcebook of Criminal
- Page 250 and 251:
Sourcebook of Criminal Justice Stat
- Page 252 and 253:
----.------------------------------
- Page 254 and 255:
------------ - ~"Sourcebook of Crim
- Page 256 and 257:
Sourcebook of Criminal Justice Stat
- Page 258 and 259:
-------- --------~------------rSour
- Page 260 and 261:
-~--~......--- --------------------
- Page 262:
Sourcebook of Criminal Justice Stat
- Page 265 and 266:
---~--- ----------- ---------------
- Page 267 and 268:
~--~----------~--------------------
- Page 269 and 270:
----------- _. ---~--------~------.
- Page 271 and 272:
Sourcebook of Criminal Justice Stat
- Page 273 and 274:
------------------- ---------------
- Page 275 and 276:
--"~ ~- .... -~--,-----Sourcebook o
- Page 277 and 278:
~-~--~......--- --------~--~- - ~--
- Page 279 and 280:
."Sourcebook of Criminal Justice St
- Page 281 and 282:
Sourcebook of Criminal Justice Stat
- Page 283 and 284:
Judicial Processing of DefendantsFi
- Page 285 and 286:
Sourcebook of Criminal Justice Stat
- Page 287 and 288:
Sourcebook of Criminal Justice ;ita
- Page 289 and 290:
--- ..... - ~-..--~--------. - ---I
- Page 291 and 292:
- ~-----~----~ -~--Figure 5.9 Civil
- Page 293 and 294:
'rIlfI. '"• ""' .. t.':>\._ ;~~,
- Page 295 and 296:
."Sourcebook of Criminol Justice St
- Page 297 and 298:
---------- - -- -Sourcebook of Crim
- Page 299 and 300:
Figure 5.11 Obscenity complaints re
- Page 301 and 302:
- ----..--~Sourcebook of Criminal J
- Page 303 and 304:
Sourcebook of Criminal Justice Stat
- Page 305 and 306:
--~- ~,,------------ -- ~JUdicial P
- Page 307 and 308:
Sourcebook of Criminal Justice Stat
- Page 309 and 310:
"Sourcebook of Criminal Justice Sta
- Page 311 and 312:
Table 6.4 Level31, 1981Sourcebook o
- Page 313 and 314:
Sourcebook of Criminal Justice Stot
- Page 315 and 316:
------ --------------------~-------
- Page 317 and 318:
Sourcebook of Criminal Justice Stat
- Page 319 and 320:
'""' - .----~-- ---~---------------
- Page 321 and 322:
---.0lIl,- ~--,.--- - - - ---------
- Page 323 and 324:
Sourcebook of Criminal Justice Stat
- Page 325 and 326:
---~~--- --- - --Sourcebook of Crim
- Page 327 and 328:
Sourcebook of Criminal Justice Stat
- Page 329 and 330:
-------- ---~-Sourcebook of Crimina
- Page 331 and 332:
:Sourcebook of Criminal Justice Sta
- Page 333 and 334:
Sourcebook of Criminal Justice Stat
- Page 335 and 336:
-'•Sourcebook of Criminal Justice
- Page 337 and 338:
,-.-~------......-~-----n.~-".~" ..
- Page 339 and 340:
SourcebG,.lk of Criminal Justice St
- Page 341 and 342:
Sourcebook of Criminal Justice Stat
- Page 343 and 344:
-----------------------------------
- Page 345 and 346:
~~------r 'I,-Sourcebook of Crimina
- Page 347 and 348:
Sourcebook of Cril"":inal Justice S
- Page 349 and 350:
----------- - -- ~------~-------~--
- Page 351 and 352:
--------~~--- --- --~--- --------Na
- Page 353 and 354:
Sourcebook of Crlmlnol Justice Stat
- Page 355 and 356:
---- - --------~Sources and Referen
- Page 357 and 358:
- ---------~Expenditure and Employm
- Page 359 and 360:
AppendicesPopulation definitionsJ!f
- Page 361 and 362:
,-Sourcebook of Criminal Justice St
- Page 363 and 364:
Appendices"NJPENDIX 7Public opinion
- Page 365 and 366:
--------------~-------APPENDIX 8ABC
- Page 367 and 368:
- -~~ - -~-----~~ ----------~------
- Page 369 and 370:
------------ - -APPENDIX 14APPENDIX
- Page 371 and 372:
--~- ~-..---Estimating procedureSou
- Page 373 and 374:
------------------------~included i
- Page 375 and 376:
---~--------~--~------Sourcebook of
- Page 377 and 378:
INDEXAbortionAbuse and neglectAcqui
- Page 379 and 380:
--~--~--,,--682rCOLRTS-MARTIAL (con
- Page 381 and 382:
---....--~,..-- -- -~ --IndexJ\.RIE
- Page 383 and 384:
------- ~(ffiOSECUTIQ\J (continued)
- Page 385 and 386:
Evaluation form forSourcebook Of Cr
- Page 387 and 388:
~ .... --------r~-- - --Bureau of J
- Page 389:
-.'>(':;'~."'\-IIIi· "IfJ./II11III