-~--~......--- ---------------------_..1<strong>Sourcebook</strong> <strong>of</strong> <strong>Criminal</strong> <strong>Justice</strong> <strong>Statistics</strong> <strong>1983</strong>Figure 4.14 Percent <strong>of</strong> violent crimes a known to police that were cleared by arrest, by e)dent <strong>of</strong> urbaniza·~;an, United States, I ~72-SIf\OTE: See f\OTES, Tables 4.1, 4.4, and 4.16. For definitions <strong>of</strong> <strong>of</strong>fenses, rural counties, and suburban and rural areas, see Appendix 2.Characteristics and Distribution <strong>of</strong> Persons ArrestedAgure 4.15 Percent <strong>of</strong> property crim·a k t Iurbanization, Unijed States, 1972-St" nown a po ice that were cleared by arrest, by extent <strong>of</strong>I'DTE: See f\OTES, Tables 4.1, 4.4, and 4.16. ~ d fl Isee Appendix 2.or e n tlons <strong>of</strong> <strong>of</strong>fenses, rural counties, and city and suburban areas, '301jeOJ"0 '"c:'" ~Q.'"7060504030...._-------------- .....----"" "" """. ··&a ..................... ··················• .... ."...........'- -......""CI ••••••••••'t:I~Q)(j '"EQ)CJ...Q)Q.2010... _-------. ..... --- ... -----~1972 1973 1974 1975 1976 1977 1978 1979 1980 1981Rural counties---Cities.....•.... Suburban areasb2010'Property crimes are <strong>of</strong>fenses <strong>of</strong> burglary larce th ft d .the Pboperty crime <strong>of</strong> arson. ,ny- e , an motor vehicle theft. Data are not included forIncludes suburban city and county law ~ t . "Suburban cities and counties are also includedei~r~:h::::ngr~~~~~les within metropolitan areas. Excludes core cities.Source: U.S. Deportment <strong>of</strong> <strong>Justice</strong> Federal B fl'107, 108; 1973, pp. 109, 110; 1974, pp. 166 167. 197/r:;ul~6 1~7tl~~~on, Crime in the U,ited States, 1972, pp.17?, 178;~, pp. 179, 180;19ll0, pp. Ilil, 113:f:i981' '5 ;r:r.-ml PP: 62, 163; 1977, pp. 162, 163;19711, pp.Office). Figure constructed by SCLRCEBCJa< staff.--' pp. I 3, I .... \rYashlngton, D.C.: U.S. GovernmentlSiiritingO~~----r_--_r----~----~I----,----,----~--~~--~1972 1973 1974 1975 1976 1977 1978 1979 1980 1981____ Rural counties----. Suburban areas b•••••••••• CitiesaViolent crimes are <strong>of</strong>fenses <strong>of</strong> murder, forible rape, robbery, andaggravated assault.blncludes suburban city and county Ic;w enforcement agencieswithin metropolitan areas. Excludes care cities. Suburban cities andcounties are also included in other groups.Source: U.S. Deportment <strong>of</strong> <strong>Justice</strong>, Federal <strong>Bureau</strong> <strong>of</strong> Investigation, Crime in the U,ited States, 1972, pp. 107, lOB; 1973, pp. 109, 110; Ir~~'pp. 166, 167; 1975, pp. 166, 167; 1976, pp. 162, 163; 19f1' pp. 162, 163, 1978, pp. 117, 178; 1979, pp.~, i80; 1980, pp.l82", 1113; 1981, pp. ,154 (Washington, D.C.: U.S. Government Printing Office. Figure constructed by 5O..RCEBOCRS'faff. --456
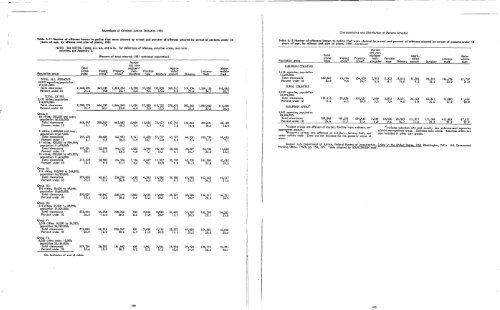
<strong>Sourcebook</strong> <strong>of</strong> <strong>Criminal</strong> <strong>Justice</strong> <strong>Statistics</strong> <strong>1983</strong>I' Characteristics and Distribution <strong>of</strong> Persons ArrestedTable It.17 Number <strong>of</strong> <strong>of</strong>fenses known to pollee that were cleared by arrest and percent <strong>of</strong> <strong>of</strong>fenses cleared by arrest <strong>of</strong> persons under 18years <strong>of</strong> age, by <strong>of</strong>fense and size <strong>of</strong> place, 1981NJTEI See /\DTES, Tables 4.1, 4.4, and 4.16. For definitions <strong>of</strong> <strong>of</strong>fenses, suburban areas, and ruralcounties, see Appendix 2.(Percent <strong>of</strong> total cleared; 1981 estimated population)Murderand non-SLBlRBI>N COl-NT I ESTotal negligent Aggra- MotorCrime Vlolenc! Properti' man- Forcible voted Larceny- vehiclePopulation group1,196 agencies; popUlationIndex crime crime slaughter rape Robbery assault Bur2lar~ theft theft 41,334,000:l'Table 4.17 Number <strong>of</strong> <strong>of</strong>fenses known to police that were cleared by arrest and percent <strong>of</strong> <strong>of</strong>fenses cleared by arrest <strong>of</strong> persons under 18years <strong>of</strong> age, by <strong>of</strong>fense and size <strong>of</strong> place, 1981 MMContinuedMurderand nonMTotal negligent AggraM MotorCrime Vi~lenc! Properti' manM Forcible voted Larceny-Population groupvehicleIndex crtme crtme slaughter rape Robbery assault Burglary theft theftTotal clearancesTOTAL ALL AGENCIES330,603 75,744 254,859 2,015 6,332 12,015 55,382 86,331 146,796Percent under 1821,73213,319 agencies; population20.9 9.8 24.2 5.5 8.1 14.0 9.2 26.6 23.2 21.2217,401,000:Total clearances 2,468,495RLRAL COl-NT I ES545,239 1,923,256 15,298 37,088 132,838 360,015 510,054 1,268,156 145,046Percent under 18 21.4 9.8 24.7 4.6 9.4 12.6 9.0 25.6 24.7 20.7 2,950 agencies; population29,992,000:TOTAL CITIES9,173 cities; populationTotal clearances 137,113 33,256 103,857 1,649 2,873 2,571 26,163 40,361 51,880Percent under 1811,616146,074,000:17.4 6.3 20.9 5.3 7.9 9.5 5.8 24.6 11:l.2 20.8Total clearances 2,000,779 436,239 1,564,540 11,634 27,883 118,252 278,470 383,362 1,069,480 III ,698Percent under 18 21.7 10.1 25.0SLBlRBI>N AREAS4.4 9.8 12.5 c9.3 25.5 25.3 20.6Q-oup I:5,963 agencies; population55 cities, 250,000 and over;85,284,000:population 40,525,000:Total clearances 783,848 149,395 634,453 3,339 10,536 24,503 111,017 171,140 415,842Percent under 1847,471Total clearances 666,047 200,565 465,482 6,489 12,856 73,477 107,743 126,86324.4 11.7300,491 38,12827.4 5.8 9.6 16.7 11.0 29.2 27.2 22.9Percent under 18 15.1 7.9 18.2 3.6 8.5 9.6 7.0 18.4 18.5 15.2 aVlolent crimes are <strong>of</strong>fenses <strong>of</strong> murder, forcible rape, robbery, am' clncludes suburban city and county law enforcementaggra'6ated assault.agencies6 cities, 1,000,000 and over;within metropolitan areas. Excludes core cities. Suburban citlC!s nrepopulation 17,617,000:~Property crimes are <strong>of</strong>fenses <strong>of</strong> bUrglary, larceny-theft, and also included In other city groups.Total clearances 255,678 88,685 166,993 3,141 4,430 37,737 43,377motor vehicle theft. Data are not included for the property crime <strong>of</strong>44,831 105,729 16,433Percent under 18arson.8.7 5.5 10.~ 2.9 10.1 5.8 5.0 9.4 11.2 7.117 cities, 500,000 to 999,999;population 11,493,000: J~Source: U.S. Department <strong>of</strong> <strong>Justice</strong>, Federal <strong>Bureau</strong> <strong>of</strong> Investigation, Crime in the United States, 1981 (Washington, D.C.: U.S. GoverrmentTotal clearances 197,091 52,978 144,113 1,632Printing Office, 1982), pp. 158, 159. Table adapted by SOLRCEBOO< staff.3,949 18,163 29,234 39,297 93,756 11,060Percent under 18 20.1 10.9 23.5 4.8 7.1 15.1 9.1 24.7 23.0 23.232 cities, 250,000 to 499,999;I ~population 11,415,000:Total clearances 213,278 58,902 154,376 1,716 4,477 17,577 35,132 42,735 101,006 10,635Percent under 18 18.2 9.0I21.7 3.6 8.1 12.0 7.8 21.9 21.8 19.3 iQ-oup II:114 cities, 100,000 to 249,999;population 16,785,000:11Total clearances299,085 60,815 238,270 1,630 4,343 15,056 39,786 61,293 162,460 14,517Percent under 18 21.3 10.6 24.0 5.3 8.5 15.2 9.2 23.5 24.5 21.3IIdnQ-oup III:291 cities, 50,000 to 99,999;~population 19,865,0001Total clearances 270,037 49,843 220,194 1,062 3,475 11,079 34,227 53,526 152,317 14,351Percent under 18 25.5 13.3 28.2 5.9 12.3 18.7 11.9 28.9 28.3 24.5Q-oup IV:i611 cities, 25,000 tv 49,999;population 21,024,000:Total clearances 272,813 44,048 228,765 933 2,812 8,820 31,483 51,910 162,590 14,265Percent under 18 26.5 13.0 29.1 6.2" .518.9 11.7 30.3 29.1 25.0Q-oup V:1,574 cities, 10,000 to 24,999;population 24,749,0001Total clearances 273,063 42,716 230,347 831 2,436 6,176 33,273 49,850 164,851 15,646Percent under 18 26.9 12.0 29.6 4.7 11.2 18.5 11.1 32.2 29.5 23.3Q-oup VI:6,528 cities under 10,000;:1popUlation 23,126,000:Total clearances '219,734 38,252 181,482 689 1,961 3,644 31,958 39,920 126,771 14,791 \i'1Percent under 18 25.6 10.6 28.7 4.2 13.2 15.6 10.0 31.9 28.4 23.1 :/See footnotes at end <strong>of</strong> table.458II' I~i:1 I'Ii11IIIiII'I/JII I,:IIiIii 1rJIIIIIIIII459
- Page 1 and 2:
u.s. Department of JusticeBureau of
- Page 3 and 4:
________ n~'·••SOURCEBOOKOF CR
- Page 5 and 6:
Sourcebook of Criminal Justice Stat
- Page 7 and 8:
Figure B An overview of detelnclude
- Page 9 and 10:
--------- - --Svurcebook of Crimina
- Page 11 and 12:
- - .. "-- - ~------~ ------------C
- Page 13 and 14:
Figure3.12 Estimated rate (per 100,
- Page 15 and 16:
TableFig. 2.6 Respondents taking pr
- Page 17 and 18:
Sourcebook of Criminal Justice Stat
- Page 19 and 20:
---------- - -- ~------------------
- Page 21 and 22:
- ...... - ~r---~---------~--------
- Page 24 and 25:
------------- - ~------~-----~-----
- Page 26 and 27:
Sourcebook of Criminal Justice Stat
- Page 28 and 29:
--------- -' -- - -'-- ----~-------
- Page 30 and 31:
---- -- --~------~ ---rl.Sourcebook
- Page 32 and 33:
~~---------- ---~----------~-------
- Page 34 and 35:
-------------- - ---~---~--------~-
- Page 36 and 37:
~~~~~~~---- - -- -Sourcebook of Cri
- Page 38 and 39:
----.... ....--.-. ~"'-.~Sourcebook
- Page 40 and 41:
(Sourcebook of Criminal Justice Sta
- Page 42 and 43:
-----~---------------------.-'-----
- Page 44 and 45:
Table 1.13 Number and rateOct. 31,
- Page 46 and 47:
~-~- ~-...--~ -- ~ ---,~-------. -.
- Page 48 and 49:
-- ..... -,-.--..-... ~~----r; __ '
- Page 50 and 51:
---..0lIl, - -~,..--- -- - - ----~-
- Page 52 and 53:
-----------------------------------
- Page 54 and 55:
.~------~--------------------------
- Page 56 and 57:
"Sourcebook of Criminal Justice Sta
- Page 58 and 59:
------------ - -- -"\I'Sourcebook o
- Page 60 and 61:
Sourcebook of Criminal Justice Stat
- Page 62 and 63:
Sourcebook of Criminal Justice Stat
- Page 65 and 66:
---- ~------~--~- -..---Sourcebook
- Page 67 and 68:
Sourcebook of Criminal Justice Stat
- Page 69 and 70:
.~f'ISourcebook of Criminal Justice
- Page 71 and 72:
Characteristics of the Criminal Jus
- Page 73 and 74:
f'Sourcebook of Criminal Justice St
- Page 75 and 76:
--'~--~---------------_..."'.".,..,
- Page 77 and 78:
'Sourcebook of Criminal Justice Sta
- Page 79 and 80:
------ ~---~-----~-----~Sourcebook
- Page 81 and 82:
-----------~-~---~-------Sourcebook
- Page 83 and 84:
-----~---~~~. -'""".-=-./}Character
- Page 85 and 86:
--------------------Sourcebook of C
- Page 87 and 88:
-----------------------------------
- Page 89 and 90:
[!r-·ISourcebook of Criminal Justi
- Page 91 and 92:
- _. - -------~--...;--~"-"----- --
- Page 93 and 94:
.~. ---..ot--~.....--- -- ~------_.
- Page 95 and 96:
Sourcebook of Criminal Justice Stat
- Page 97 and 98:
--""'1,- ~,.--- --_'M~II!tlT'-~'r.
- Page 99 and 100:
- -~--~--~-~~-------~----------Tabl
- Page 101 and 102:
~~--~~--~-----~ ----Sourcebook of C
- Page 103 and 104:
~-~-------------------------_--____
- Page 105 and 106:
------------Sourcebook of Criminal
- Page 107 and 108:
Sourcebook of Criminal Justice Stat
- Page 109 and 110:
Characteristics of the Criminal Jus
- Page 111 and 112:
------- -- - -- -Sourcebook of Crim
- Page 113 and 114:
"Sourcebook of Criminal Justice Sta
- Page 115 and 116:
Sourcebook of Criminal Justice Stat
- Page 117 and 118:
------"'--~ ,'~- =--Sourcebook of C
- Page 119 and 120:
Sourcebook of Criminal Justice S;at
- Page 121 and 122:
,,iSourcebook of Criminal Justice S
- Page 123 and 124:
Source: George H. Gallup, The Gallu
- Page 125 and 126:
----~------~~--~----------~--------
- Page 127 and 128:
Sourcebook of Criminal Justice Stat
- Page 129 and 130:
--------------Sourcebook of Crimina
- Page 131 and 132:
--~-~~~~---------'---Public Attitud
- Page 133 and 134:
---------------------Sourcebook of
- Page 135 and 136:
-----------------------------------
- Page 137 and 138:
----------- --~-_.------~---t]Sourc
- Page 139 and 140:
Sourcebook of Criminal Justice Stat
- Page 141 and 142:
234Sourcebook of Criminal Justice S
- Page 143 and 144:
Sourcebook of Criminal Justice Stat
- Page 145 and 146:
~---.-.-.~~~ .. ~.Sourcebook of Cri
- Page 147 and 148:
,~--------~---------------~--------
- Page 149 and 150:
-~---------i': 1r\ jI~1 Public Atti
- Page 151 and 152:
--~---------------~----------Source
- Page 153 and 154:
~-~ - -'--~-------~----~~----------
- Page 155 and 156:
~-~- ~-----------------------------
- Page 157 and 158:
· -.Figure 2.14 Attitudes toward t
- Page 159 and 160:
Sourcebook of Criminal Justice Stat
- Page 161 and 162:
Sourcebook of Criminal Justice Stat
- Page 163 and 164:
--"'" - -~--..--- -Sourcebook of Cr
- Page 166 and 167:
.,.----------- - --" ,,jSourcebook
- Page 168 and 169:
~---~----~---" '--Sourcebook of Cri
- Page 170 and 171:
Sourcebook of Criminal Justice Stat
- Page 172 and 173:
....... ,-"'-~--... ~.Sourcebook of
- Page 174 and 175:
-- ..... --~.....-- -- -~ --'\,j--S
- Page 176 and 177:
"~Sourcebook of Criminal Justice St
- Page 178 and 179:
--~----- --~-----r\ I,I.-------. "
- Page 180 and 181:
---------------------,-------------
- Page 182 and 183:
Sourcebook of Criminal Justice Stat
- Page 184 and 185:
--------------------_.;e __ ... , .
- Page 186 and 187:
-----_.----------------------------
- Page 188 and 189:
--~--~-...---Sourcebook of Criminal
- Page 190 and 191:
----....--,-"..__._-..- ~ -- ~~ ...
- Page 192 and 193:
-- ..... -~-..---=4'CI)("")CI)9:::s
- Page 194 and 195:
-~-~ -----------------Sourcebook of
- Page 196 and 197:
Nature and Distribution of Known Of
- Page 198 and 199:
--------.-~ '-'=~~-------- -- -I1Na
- Page 200 and 201:
Nature and Distribution of Known Of
- Page 202 and 203:
---------~----------------~--------
- Page 204 and 205:
-------'''*'''_''' __ ,~=IW".(ISour
- Page 206 and 207:
;1INoture ond Distribution of /
- Page 208 and 209:
~~~-~----- ---- -~---~---~--~~-----
- Page 210 and 211: Sourcebook of Criminol Justice Stat
- Page 212 and 213: ~ ---~ ---------- - ---Sout!:eboci<
- Page 214 and 215: - ~--J."'~~~"_~ ..~F'"-_ ....Source
- Page 216 and 217: Nature and Distribution of Known Of
- Page 218 and 219: --------"Source bo 0 k of Crimi no
- Page 220 and 221: Sourcebook of Criminol Justice Stat
- Page 222 and 223: "---- ~ -------~~ -----------------
- Page 224 and 225: .------~~- --~Sourcebook of Crimina
- Page 226 and 227: 396----------- -- ~Sourcebook of Cr
- Page 228 and 229: Sourcebook of Criminal Justice Stat
- Page 230 and 231: --Agure 3.24 Rate (per 100 officers
- Page 232 and 233: 407-~------- ----Sourcebook of Crim
- Page 234 and 235: ------------- -- ~Sourcebook of Cri
- Page 236 and 237: Characteristics and Distribution of
- Page 238 and 239: ---.0lIl, - ~-.,---------- . ---Sou
- Page 240 and 241: --~----~c,Sourcebook of Criminal Ju
- Page 242 and 243: ------------ - -- ----- --------~II
- Page 244 and 245: - ----~--~\"r--. 'I[I)1Ir ri II.~\,
- Page 246 and 247: .~--,..., - -~ --..--- --~ ----~---
- Page 248 and 249: -------_ .. -Sourcebook of Criminal
- Page 250 and 251: Sourcebook of Criminal Justice Stat
- Page 252 and 253: ----.------------------------------
- Page 254 and 255: ------------ - ~"Sourcebook of Crim
- Page 256 and 257: Sourcebook of Criminal Justice Stat
- Page 258 and 259: -------- --------~------------rSour
- Page 262: Sourcebook of Criminal Justice Stat
- Page 265 and 266: ---~--- ----------- ---------------
- Page 267 and 268: ~--~----------~--------------------
- Page 269 and 270: ----------- _. ---~--------~------.
- Page 271 and 272: Sourcebook of Criminal Justice Stat
- Page 273 and 274: ------------------- ---------------
- Page 275 and 276: --"~ ~- .... -~--,-----Sourcebook o
- Page 277 and 278: ~-~--~......--- --------~--~- - ~--
- Page 279 and 280: ."Sourcebook of Criminal Justice St
- Page 281 and 282: Sourcebook of Criminal Justice Stat
- Page 283 and 284: Judicial Processing of DefendantsFi
- Page 285 and 286: Sourcebook of Criminal Justice Stat
- Page 287 and 288: Sourcebook of Criminal Justice ;ita
- Page 289 and 290: --- ..... - ~-..--~--------. - ---I
- Page 291 and 292: - ~-----~----~ -~--Figure 5.9 Civil
- Page 293 and 294: 'rIlfI. '"• ""' .. t.':>\._ ;~~,
- Page 295 and 296: ."Sourcebook of Criminol Justice St
- Page 297 and 298: ---------- - -- -Sourcebook of Crim
- Page 299 and 300: Figure 5.11 Obscenity complaints re
- Page 301 and 302: - ----..--~Sourcebook of Criminal J
- Page 303 and 304: Sourcebook of Criminal Justice Stat
- Page 305 and 306: --~- ~,,------------ -- ~JUdicial P
- Page 307 and 308: Sourcebook of Criminal Justice Stat
- Page 309 and 310: "Sourcebook of Criminal Justice Sta
- Page 311 and 312:
Table 6.4 Level31, 1981Sourcebook o
- Page 313 and 314:
Sourcebook of Criminal Justice Stot
- Page 315 and 316:
------ --------------------~-------
- Page 317 and 318:
Sourcebook of Criminal Justice Stat
- Page 319 and 320:
'""' - .----~-- ---~---------------
- Page 321 and 322:
---.0lIl,- ~--,.--- - - - ---------
- Page 323 and 324:
Sourcebook of Criminal Justice Stat
- Page 325 and 326:
---~~--- --- - --Sourcebook of Crim
- Page 327 and 328:
Sourcebook of Criminal Justice Stat
- Page 329 and 330:
-------- ---~-Sourcebook of Crimina
- Page 331 and 332:
:Sourcebook of Criminal Justice Sta
- Page 333 and 334:
Sourcebook of Criminal Justice Stat
- Page 335 and 336:
-'•Sourcebook of Criminal Justice
- Page 337 and 338:
,-.-~------......-~-----n.~-".~" ..
- Page 339 and 340:
SourcebG,.lk of Criminal Justice St
- Page 341 and 342:
Sourcebook of Criminal Justice Stat
- Page 343 and 344:
-----------------------------------
- Page 345 and 346:
~~------r 'I,-Sourcebook of Crimina
- Page 347 and 348:
Sourcebook of Cril"":inal Justice S
- Page 349 and 350:
----------- - -- ~------~-------~--
- Page 351 and 352:
--------~~--- --- --~--- --------Na
- Page 353 and 354:
Sourcebook of Crlmlnol Justice Stat
- Page 355 and 356:
---- - --------~Sources and Referen
- Page 357 and 358:
- ---------~Expenditure and Employm
- Page 359 and 360:
AppendicesPopulation definitionsJ!f
- Page 361 and 362:
,-Sourcebook of Criminal Justice St
- Page 363 and 364:
Appendices"NJPENDIX 7Public opinion
- Page 365 and 366:
--------------~-------APPENDIX 8ABC
- Page 367 and 368:
- -~~ - -~-----~~ ----------~------
- Page 369 and 370:
------------ - -APPENDIX 14APPENDIX
- Page 371 and 372:
--~- ~-..---Estimating procedureSou
- Page 373 and 374:
------------------------~included i
- Page 375 and 376:
---~--------~--~------Sourcebook of
- Page 377 and 378:
INDEXAbortionAbuse and neglectAcqui
- Page 379 and 380:
--~--~--,,--682rCOLRTS-MARTIAL (con
- Page 381 and 382:
---....--~,..-- -- -~ --IndexJ\.RIE
- Page 383 and 384:
------- ~(ffiOSECUTIQ\J (continued)
- Page 385 and 386:
Evaluation form forSourcebook Of Cr
- Page 387 and 388:
~ .... --------r~-- - --Bureau of J
- Page 389:
-.'>(':;'~."'\-IIIi· "IfJ./II11III