Proceedings in pdf format. - Sociotechnical Systems Engineering ...
Proceedings in pdf format. - Sociotechnical Systems Engineering ...
Proceedings in pdf format. - Sociotechnical Systems Engineering ...

Create successful ePaper yourself
Turn your PDF publications into a flip-book with our unique Google optimized e-Paper software.
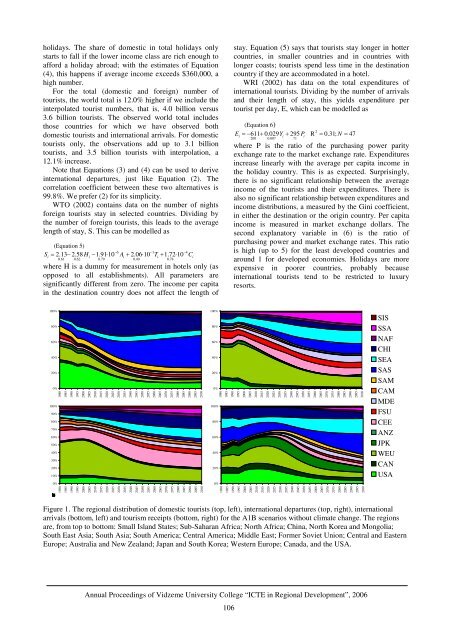
200%0%19802045holidays. The share of domestic <strong>in</strong> total holidays onlystarts to fall if the lower <strong>in</strong>come class are rich enough toafford a holiday abroad; with the estimates of Equation(4), this happens if average <strong>in</strong>come exceeds $360,000, ahigh number.For the total (domestic and foreign) number oftourists, the world total is 12.0% higher if we <strong>in</strong>clude the<strong>in</strong>terpolated tourist numbers, that is, 4.0 billion versus3.6 billion tourists. The observed world total <strong>in</strong>cludesthose countries for which we have observed bothdomestic tourists and <strong>in</strong>ternational arrivals. For domestictourists only, the observations add up to 3.1 billiontourists, and 3.5 billion tourists with <strong>in</strong>terpolation, a12.1% <strong>in</strong>crease.Note that Equations (3) and (4) can be used to derive<strong>in</strong>ternational departures, just like Equation (2). Thecorrelation coefficient between these two alternatives is99.8%. We prefer (2) for its simplicity.WTO (2002) conta<strong>in</strong>s data on the number of nightsforeign tourists stay <strong>in</strong> selected countries. Divid<strong>in</strong>g bythe number of foreign tourists, this leads to the averagelength of stay, S. This can be modelled as(Equation 5)−6 −1 −4S = 2.13− 2.58 H −1.91⋅ 10 A + 2.06⋅ 10 T + 1.72⋅10Ci i i i i0.61 0.62 0.79 0.40 0.78where H is a dummy for measurement <strong>in</strong> hotels only (asopposed to all establishments). All parameters aresignificantly different from zero. The <strong>in</strong>come per capita<strong>in</strong> the dest<strong>in</strong>ation country does not affect the length ofstay. Equation (5) says that tourists stay longer <strong>in</strong> hottercountries, <strong>in</strong> smaller countries and <strong>in</strong> countries withlonger coasts; tourists spend less time <strong>in</strong> the dest<strong>in</strong>ationcountry if they are accommodated <strong>in</strong> a hotel.WRI (2002) has data on the total expenditures of<strong>in</strong>ternational tourists. Divid<strong>in</strong>g by the number of arrivalsand their length of stay, this yields expenditure pertourist per day, E, which can be modelled as(Equation 6)2E = − 611+ 0.029Y + 295 P R = 0.31; N = 47i i i200 0.007 71where P is the ratio of the purchas<strong>in</strong>g power parityexchange rate to the market exchange rate. Expenditures<strong>in</strong>crease l<strong>in</strong>early with the average per capita <strong>in</strong>come <strong>in</strong>the holiday country. This is as expected. Surpris<strong>in</strong>gly,there is no significant relationship between the average<strong>in</strong>come of the tourists and their expenditures. There isalso no significant relationship between expenditures and<strong>in</strong>come distributions, a measured by the G<strong>in</strong>i coefficient,<strong>in</strong> either the dest<strong>in</strong>ation or the orig<strong>in</strong> country. Per capita<strong>in</strong>come is measured <strong>in</strong> market exchange dollars. Thesecond explanatory variable <strong>in</strong> (6) is the ratio ofpurchas<strong>in</strong>g power and market exchange rates. This ratiois high (up to 5) for the least developed countries andaround 1 for developed economies. Holidays are moreexpensive <strong>in</strong> poorer countries, probably because<strong>in</strong>ternational tourists tend to be restricted to luxuryresorts.100%80%60%40%20%0%100%90%80%70%60%50%40%30%20%10%0%19801985199019952000200520102015202020252030203520402045205020552060206520702075208020852090209521001980198519901995200020052010201520202025203020352040204520502055206020652070207520802085209020952100100%80%60%40%20%0%100%80%60%40%20%0%19801985199019952000200520102015202020252030203520402045205020552060206520702075208020852090209521001980198519901995200020052010201520202025203020352040204520502055206020652070207520802085209020952100SISSSANAFCHISEASASSAMCAMMDEFSUCEEANZJPKWEUCANUSAFigure 1. The regional distribution of domestic tourists (top, left), <strong>in</strong>ternational departures (top, right), <strong>in</strong>ternationalarrivals (bottom, left) and tourism receipts (bottom, right) for the A1B scenarios without climate change. The regionsare, from top to bottom: Small Island States; Sub-Saharan Africa; North Africa; Ch<strong>in</strong>a, North Korea and Mongolia;South East Asia; South Asia; South America; Central America; Middle East; Former Soviet Union; Central and EasternEurope; Australia and New Zealand; Japan and South Korea; Western Europe; Canada, and the USA.Annual <strong>Proceed<strong>in</strong>gs</strong> of Vidzeme University College “ICTE <strong>in</strong> Regional Development”, 2006106