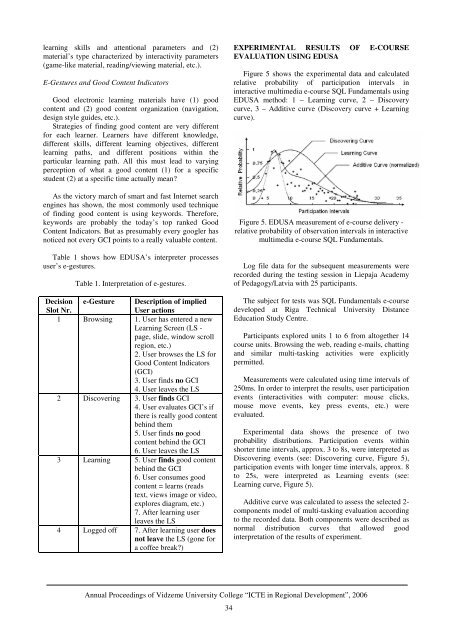
learn<strong>in</strong>g skills and attentional parameters and (2)material’s type characterized by <strong>in</strong>teractivity parameters(game-like material, read<strong>in</strong>g/view<strong>in</strong>g material, etc.).E-Gestures and Good Content IndicatorsGood electronic learn<strong>in</strong>g materials have (1) goodcontent and (2) good content organization (navigation,design style guides, etc.).Strategies of f<strong>in</strong>d<strong>in</strong>g good content are very differentfor each learner. Learners have different knowledge,different skills, different learn<strong>in</strong>g objectives, differentlearn<strong>in</strong>g paths, and different positions with<strong>in</strong> theparticular learn<strong>in</strong>g path. All this must lead to vary<strong>in</strong>gperception of what a good content (1) for a specificstudent (2) at a specific time actually mean?As the victory march of smart and fast Internet searcheng<strong>in</strong>es has shown, the most commonly used techniqueof f<strong>in</strong>d<strong>in</strong>g good content is us<strong>in</strong>g keywords. Therefore,keywords are probably the today’s top ranked GoodContent Indicators. But as presumably every googler hasnoticed not every GCI po<strong>in</strong>ts to a really valuable content.Table 1 shows how EDUSA’s <strong>in</strong>terpreter processesuser’s e-gestures.DecisionSlot Nr.Table 1. Interpretation of e-gestures.e-GestureDescription of impliedUser actions1 Brows<strong>in</strong>g 1. User has entered a newLearn<strong>in</strong>g Screen (LS -page, slide, w<strong>in</strong>dow scrollregion, etc.)2. User browses the LS forGood Content Indicators(GCI)3. User f<strong>in</strong>ds no GCI4. User leaves the LS2 Discover<strong>in</strong>g 3. User f<strong>in</strong>ds GCI4. User evaluates GCI’s ifthere is really good contentbeh<strong>in</strong>d them5. User f<strong>in</strong>ds no goodcontent beh<strong>in</strong>d the GCI6. User leaves the LS3 Learn<strong>in</strong>g 5. User f<strong>in</strong>ds good contentbeh<strong>in</strong>d the GCI6. User consumes goodcontent = learns (readstext, views image or video,explores diagram, etc.)7. After learn<strong>in</strong>g userleaves the LS4 Logged off 7. After learn<strong>in</strong>g user doesnot leave the LS (gone fora coffee break?)EXPERIMENTAL RESULTS OF E-COURSEEVALUATION USING EDUSAFigure 5 shows the experimental data and calculatedrelative probability of participation <strong>in</strong>tervals <strong>in</strong><strong>in</strong>teractive multimedia e-course SQL Fundamentals us<strong>in</strong>gEDUSA method: 1 – Learn<strong>in</strong>g curve, 2 – Discoverycurve, 3 – Additive curve (Discovery curve + Learn<strong>in</strong>gcurve).Figure 5. EDUSA measurement of e-course delivery -relative probability of observation <strong>in</strong>tervals <strong>in</strong> <strong>in</strong>teractivemultimedia e-course SQL Fundamentals.Log file data for the subsequent measurements wererecorded dur<strong>in</strong>g the test<strong>in</strong>g session <strong>in</strong> Liepaja Academyof Pedagogy/Latvia with 25 participants.The subject for tests was SQL Fundamentals e-coursedeveloped at Riga Technical University DistanceEducation Study Centre.Participants explored units 1 to 6 from altogether 14course units. Brows<strong>in</strong>g the web, read<strong>in</strong>g e-mails, chatt<strong>in</strong>gand similar multi-task<strong>in</strong>g activities were explicitlypermitted.Measurements were calculated us<strong>in</strong>g time <strong>in</strong>tervals of250ms. In order to <strong>in</strong>terpret the results, user participationevents (<strong>in</strong>teractivities with computer: mouse clicks,mouse move events, key press events, etc.) wereevaluated.Experimental data shows the presence of twoprobability distributions. Participation events with<strong>in</strong>shorter time <strong>in</strong>tervals, approx. 3 to 8s, were <strong>in</strong>terpreted asDiscover<strong>in</strong>g events (see: Discover<strong>in</strong>g curve, Figure 5),participation events with longer time <strong>in</strong>tervals, approx. 8to 25s, were <strong>in</strong>terpreted as Learn<strong>in</strong>g events (see:Learn<strong>in</strong>g curve, Figure 5).Additive curve was calculated to assess the selected 2-components model of multi-task<strong>in</strong>g evaluation accord<strong>in</strong>gto the recorded data. Both components were described asnormal distribution curves that allowed good<strong>in</strong>terpretation of the results of experiment.Annual <strong>Proceed<strong>in</strong>gs</strong> of Vidzeme University College “ICTE <strong>in</strong> Regional Development”, 200634
CONCLUSIONSEDUSA method gives us a tool to measure relativeprobability of user participation <strong>in</strong>tervals <strong>in</strong> <strong>in</strong>teractivemultimedia e-courses <strong>in</strong> multi-task<strong>in</strong>g environments.Participation probability is cumulative value ofDiscover<strong>in</strong>g curve and Learn<strong>in</strong>g curve relativeprobability.Given the large <strong>in</strong>vestments organizations are mak<strong>in</strong>g<strong>in</strong> onl<strong>in</strong>e tra<strong>in</strong><strong>in</strong>g, and the unique needs of non-l<strong>in</strong>earmulti-task<strong>in</strong>g learners, it would be prudent to address theusability of m-learn<strong>in</strong>g applications for this extremelylarge emerg<strong>in</strong>g target group.Do<strong>in</strong>g so will help ensure that such users can actuallyaccess the necessary material, have optimal levels ofsatisfaction with the learn<strong>in</strong>g experience, and enable theorganization to maximize its m-learn<strong>in</strong>g <strong>in</strong>vestment.To our knowledge most of the traditional approachesof assess<strong>in</strong>g the effectiveness of e-learn<strong>in</strong>g materials arenot oriented to target the new e-generation of learners,especially their non-l<strong>in</strong>ear multi-task<strong>in</strong>g abilities.This is why we consider the EDUSA-approach moresensitive to the skills and competencies of the newlyemerg<strong>in</strong>g technically savvy media aware learners thanmost of the traditional evaluation methods.The pilot<strong>in</strong>g results of EDUSA system allow us toconclude that it will be probably better able to assess theeffectiveness of materials/learn<strong>in</strong>g tasks for multi-task<strong>in</strong>glearners than most traditional approaches.Specifically, we expect that the high degree ofunobtrusiveness through extended automation and usageof advanced e-gesture <strong>in</strong>terpreters could contribute toacceptance of evaluation systems of this k<strong>in</strong>d <strong>in</strong> the nearfuture.REFERENCESVeen, W. 2006. Teach<strong>in</strong>g the media generation, Cop<strong>in</strong>gwith Homo Zappiens.Dennett, D.C. 1998. Bra<strong>in</strong>children, Essays on Design<strong>in</strong>gM<strong>in</strong>ds.Miller, M.J. 2005. Usability <strong>in</strong> e-Learn<strong>in</strong>g.Carr, J. 2003. Communication through The Learn<strong>in</strong>gPlace.BIOGRAPHYArmands Strazds is the European Commission’s NEMVision group expert from Latvia. S<strong>in</strong>ce 2003, he is theDirector of ZIME Foundation, vice-president of theEnvironmental Education Foundation ‘Keep LatviaTidy’, member of IEEE and Latvian In<strong>format</strong>ionTechnologies and Telecommunications Association(LIKTA). He is lecturer and researcher of Riga TechnicalUniversity and currently works on his doctoraldissertation about ubiquitous e-learn<strong>in</strong>g.Atis Kapenieks has education <strong>in</strong> Physics and PhD fromUniversity of Latvia. He is Director of Riga TechnicalUniversity Distance Education Study Centre.Experienced <strong>in</strong> IT, Research, e-learn<strong>in</strong>g andadm<strong>in</strong>istration, Director of Department of HigherEducation and Research, Latvian M<strong>in</strong>istry of Educationand Science 1991-1997.Dr. Atis Kapenieks has participated <strong>in</strong> more than 20<strong>in</strong>ternational e-learn<strong>in</strong>g development projects <strong>in</strong> Europe.Over 60 publications on physics, 6 publications on highereducation and research policy, 15 on Internet andMultimedia applications <strong>in</strong> e-learn<strong>in</strong>g. Current scientific<strong>in</strong>terest: virtual learn<strong>in</strong>g environments, multimediaapplications e- learn<strong>in</strong>g and regional development.Bruno Zuga has MSc degree <strong>in</strong> Electronics andTelecommunications eng<strong>in</strong>eer<strong>in</strong>g from Riga TechnicalUniversity (RTU). Bruno Zuga is author or co-author ofmore than ten <strong>in</strong>ternational publications <strong>in</strong> e-learn<strong>in</strong>g andmultimedia. At present, he is a PhD student at RTU. Inessence the research topic deals with question “Howexactly technology supports learn<strong>in</strong>g?” the approach ismultidiscipl<strong>in</strong>ary. Besides his studies, Bruno is work<strong>in</strong>gat RTU Distance Education Study Centre. He hasparticipated <strong>in</strong> about 20 national/<strong>in</strong>ternational e-learn<strong>in</strong>gand knowledge management projects. He likes his workand enjoys almost every aspect of it, especially the onethat <strong>in</strong>volves <strong>in</strong>ternational collaboration.Myers, B.A. 1996. A brief history of Human ComputerInteraction Technology.Shilwant, S., A. Haggarty. 2005. Usability Test<strong>in</strong>g for E-Learn<strong>in</strong>g.Annual <strong>Proceed<strong>in</strong>gs</strong> of Vidzeme University College “ICTE <strong>in</strong> Regional Development”, 200635
- Page 1 and 2: ISBN 9984-633-03-9Annual Proceeding
- Page 3 and 4: “Development of Creative Human -
- Page 5 and 6: TABLE OF CONTENTSINTELLIGENT SYSTEM
- Page 7 and 8: INTELLIGENT SYSTEM FOR LEARNERS’
- Page 9 and 10: LEARNER 1GROUP OF HUMAN AGENTSLEARN
- Page 11 and 12: QuantityQuantityFigure 6. Distribut
- Page 13 and 14: LEARNERStructure of theconcept mapL
- Page 15 and 16: WEB-BASED INTELLIGENT TUTORING SYST
- Page 17 and 18: materials to be presented and which
- Page 19 and 20: INFORMATION TECHNOLOGIES AND E-LEAR
- Page 21 and 22: correspondence with the course aim
- Page 23 and 24: projects and through IT. Hence, it
- Page 25 and 26: APPLICATION OF MODELING METHODS IN
- Page 27 and 28: can support configuration managemen
- Page 29 and 30: The EKD is one of the Enterprise mo
- Page 31 and 32: CHANGES TO TRAINING AND PERSPECTIVE
- Page 33 and 34: or an end, yet none of these attitu
- Page 35 and 36: make decisions. It cannot be volunt
- Page 37 and 38: logs), data and video conferencing
- Page 39: Ability to follow user’s multi-ta
- Page 43 and 44: in successful SD. Given this situat
- Page 45 and 46: SPATIAL INFORMATIONFor the visualis
- Page 47 and 48: MOBILE TECHNOLOGIES USE IN SERVICES
- Page 49 and 50: learning environment (Learning Mana
- Page 51 and 52: ago only some curricula on Logistic
- Page 53 and 54: The Web-based version can be access
- Page 55 and 56: Web-portal, which incorporates diff
- Page 57 and 58: DO INTELLIGENT OBJECTS AUTOMATICALL
- Page 59 and 60: Table 1. Examples for introducing R
- Page 61 and 62: workable influencing of the process
- Page 63 and 64: are handed over to the objects and
- Page 65 and 66: • Basic processes, such as wareho
- Page 67 and 68: THE ECR E-COACH: A VIRTUAL COACHING
- Page 69 and 70: participating in the workshops and
- Page 71 and 72: • Assessment modules enable indiv
- Page 73 and 74: with pictures and illustrated graph
- Page 75 and 76: ECR Question Banknumber category su
- Page 77 and 78: educational programme that follows
- Page 79 and 80: DEVELOPMENT OF WEB BASED GRAVITY MO
- Page 81 and 82: These results of a model require a
- Page 83 and 84: CONCLUSIONSThe main goal of work ha
- Page 85 and 86: dimension and included within any o
- Page 87 and 88: • Resources sharing by providing
- Page 89 and 90: Pursuant to the guidelines of elect
- Page 91 and 92:
tariffs of regulated services have
- Page 93 and 94:
INFORMATION TECHNOLOGY FOR MOTIVATI
- Page 95 and 96:
difficult to predict when and for w
- Page 97 and 98:
Listeners' workon the WebListenersS
- Page 99 and 100:
PERSPECTIVES OF WEB PAGE AND E-MAIL
- Page 101 and 102:
INCREASE IN THE NUMBER OF INTERNETU
- Page 103 and 104:
tourism accommodations (home pages
- Page 105 and 106:
interactive relationships with clie
- Page 107 and 108:
• The data obtained by the resear
- Page 109 and 110:
Central Statistical Bureau of Latvi
- Page 111 and 112:
departures for 1995 are taken from
- Page 113 and 114:
120100maximumworldminimum806040200-
- Page 115 and 116:
140120maximumworldminimum1008060402
- Page 117 and 118:
would be a promising extension. Cur
- Page 119 and 120:
AN OVERVIEW OF THE AGENT − BASED
- Page 121 and 122:
Suitability for social system simul
- Page 123 and 124:
6. MASONDescription:MASON is a fast
- Page 125 and 126:
Suitability for social system simul
- Page 127 and 128:
could be bad particularly when over
- Page 129 and 130:
(for 10 repeat &| CCar[]->runfor);P
- Page 131 and 132:
• Streaming audio• Collaboratio
- Page 133 and 134:
NECESSITY OF NEW LAYERED APPROACH T
- Page 135 and 136:
Up to now, there has only been limi
- Page 137 and 138:
aaaaa6= −aa2,1 = − a0,3226= −
- Page 139 and 140:
∂ u∂x∂ u∂y2 2+ b = 02 2wher
- Page 141 and 142:
a6,3= −2030a4,5−130a4,3- - - -
- Page 143 and 144:
0,10,20,30,4( )Mag x y y Ge wx2, =
- Page 145 and 146:
Example 1. To understand better the
- Page 147 and 148:
Therefore, further the following co
- Page 149 and 150:
SOLUTION OF THE THREE-DIMENSIONALEQ
- Page 151 and 152:
Mag1, m , m , m1 2 3= mm1 m2m32 2 2
- Page 153 and 154:
MagMag0, m , m , m1 2 31, m , m , m
- Page 155:
CONCLUSIONSThe basic content of thi