200%0%19802045holidays. The share of domestic <strong>in</strong> total holidays onlystarts to fall if the lower <strong>in</strong>come class are rich enough toafford a holiday abroad; with the estimates of Equation(4), this happens if average <strong>in</strong>come exceeds $360,000, ahigh number.For the total (domestic and foreign) number oftourists, the world total is 12.0% higher if we <strong>in</strong>clude the<strong>in</strong>terpolated tourist numbers, that is, 4.0 billion versus3.6 billion tourists. The observed world total <strong>in</strong>cludesthose countries for which we have observed bothdomestic tourists and <strong>in</strong>ternational arrivals. For domestictourists only, the observations add up to 3.1 billiontourists, and 3.5 billion tourists with <strong>in</strong>terpolation, a12.1% <strong>in</strong>crease.Note that Equations (3) and (4) can be used to derive<strong>in</strong>ternational departures, just like Equation (2). Thecorrelation coefficient between these two alternatives is99.8%. We prefer (2) for its simplicity.WTO (2002) conta<strong>in</strong>s data on the number of nightsforeign tourists stay <strong>in</strong> selected countries. Divid<strong>in</strong>g bythe number of foreign tourists, this leads to the averagelength of stay, S. This can be modelled as(Equation 5)−6 −1 −4S = 2.13− 2.58 H −1.91⋅ 10 A + 2.06⋅ 10 T + 1.72⋅10Ci i i i i0.61 0.62 0.79 0.40 0.78where H is a dummy for measurement <strong>in</strong> hotels only (asopposed to all establishments). All parameters aresignificantly different from zero. The <strong>in</strong>come per capita<strong>in</strong> the dest<strong>in</strong>ation country does not affect the length ofstay. Equation (5) says that tourists stay longer <strong>in</strong> hottercountries, <strong>in</strong> smaller countries and <strong>in</strong> countries withlonger coasts; tourists spend less time <strong>in</strong> the dest<strong>in</strong>ationcountry if they are accommodated <strong>in</strong> a hotel.WRI (2002) has data on the total expenditures of<strong>in</strong>ternational tourists. Divid<strong>in</strong>g by the number of arrivalsand their length of stay, this yields expenditure pertourist per day, E, which can be modelled as(Equation 6)2E = − 611+ 0.029Y + 295 P R = 0.31; N = 47i i i200 0.007 71where P is the ratio of the purchas<strong>in</strong>g power parityexchange rate to the market exchange rate. Expenditures<strong>in</strong>crease l<strong>in</strong>early with the average per capita <strong>in</strong>come <strong>in</strong>the holiday country. This is as expected. Surpris<strong>in</strong>gly,there is no significant relationship between the average<strong>in</strong>come of the tourists and their expenditures. There isalso no significant relationship between expenditures and<strong>in</strong>come distributions, a measured by the G<strong>in</strong>i coefficient,<strong>in</strong> either the dest<strong>in</strong>ation or the orig<strong>in</strong> country. Per capita<strong>in</strong>come is measured <strong>in</strong> market exchange dollars. Thesecond explanatory variable <strong>in</strong> (6) is the ratio ofpurchas<strong>in</strong>g power and market exchange rates. This ratiois high (up to 5) for the least developed countries andaround 1 for developed economies. Holidays are moreexpensive <strong>in</strong> poorer countries, probably because<strong>in</strong>ternational tourists tend to be restricted to luxuryresorts.100%80%60%40%20%0%100%90%80%70%60%50%40%30%20%10%0%19801985199019952000200520102015202020252030203520402045205020552060206520702075208020852090209521001980198519901995200020052010201520202025203020352040204520502055206020652070207520802085209020952100100%80%60%40%20%0%100%80%60%40%20%0%19801985199019952000200520102015202020252030203520402045205020552060206520702075208020852090209521001980198519901995200020052010201520202025203020352040204520502055206020652070207520802085209020952100SISSSANAFCHISEASASSAMCAMMDEFSUCEEANZJPKWEUCANUSAFigure 1. The regional distribution of domestic tourists (top, left), <strong>in</strong>ternational departures (top, right), <strong>in</strong>ternationalarrivals (bottom, left) and tourism receipts (bottom, right) for the A1B scenarios without climate change. The regionsare, from top to bottom: Small Island States; Sub-Saharan Africa; North Africa; Ch<strong>in</strong>a, North Korea and Mongolia;South East Asia; South Asia; South America; Central America; Middle East; Former Soviet Union; Central and EasternEurope; Australia and New Zealand; Japan and South Korea; Western Europe; Canada, and the USA.Annual <strong>Proceed<strong>in</strong>gs</strong> of Vidzeme University College “ICTE <strong>in</strong> Regional Development”, 2006106
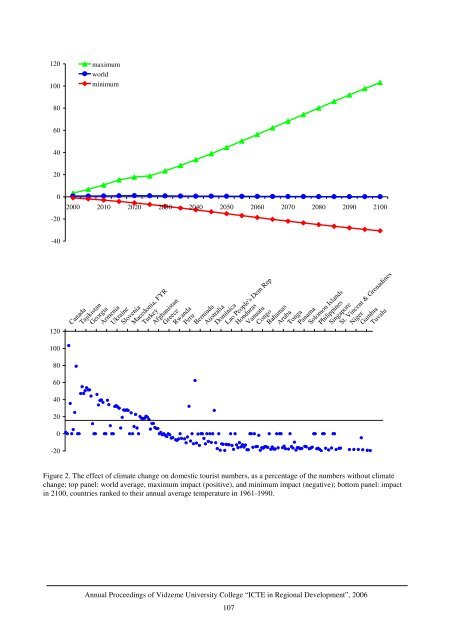
120100maximumworldm<strong>in</strong>imum806040200-202000 2010 2020 2030 2040 2050 2060 2070 2080 2090 2100-40120100806040CanadaTajikistanGeorgiaArmeniaUkra<strong>in</strong>eSloveniaMacedonia, FYRTurkeyAfghanistanGreeceRwandaPeruBermudaAustraliaDom<strong>in</strong>icaLao People's Dem RepHondurasVanuatuCongoBahamasArubaTongaPanamaSolomon IslandsPhilipp<strong>in</strong>esS<strong>in</strong>gaporeSt. V<strong>in</strong>cent & Grenad<strong>in</strong>esNigerGambiaTuvalu200-20Figure 2. The effect of climate change on domestic tourist numbers, as a percentage of the numbers without climatechange; top panel: world average, maximum impact (positive), and m<strong>in</strong>imum impact (negative); bottom panel: impact<strong>in</strong> 2100, countries ranked to their annual average temperature <strong>in</strong> 1961-1990.Annual <strong>Proceed<strong>in</strong>gs</strong> of Vidzeme University College “ICTE <strong>in</strong> Regional Development”, 2006107
- Page 1 and 2:
ISBN 9984-633-03-9Annual Proceeding
- Page 3 and 4:
“Development of Creative Human -
- Page 5 and 6:
TABLE OF CONTENTSINTELLIGENT SYSTEM
- Page 7 and 8:
INTELLIGENT SYSTEM FOR LEARNERS’
- Page 9 and 10:
LEARNER 1GROUP OF HUMAN AGENTSLEARN
- Page 11 and 12:
QuantityQuantityFigure 6. Distribut
- Page 13 and 14:
LEARNERStructure of theconcept mapL
- Page 15 and 16:
WEB-BASED INTELLIGENT TUTORING SYST
- Page 17 and 18:
materials to be presented and which
- Page 19 and 20:
INFORMATION TECHNOLOGIES AND E-LEAR
- Page 21 and 22:
correspondence with the course aim
- Page 23 and 24:
projects and through IT. Hence, it
- Page 25 and 26:
APPLICATION OF MODELING METHODS IN
- Page 27 and 28:
can support configuration managemen
- Page 29 and 30:
The EKD is one of the Enterprise mo
- Page 31 and 32:
CHANGES TO TRAINING AND PERSPECTIVE
- Page 33 and 34:
or an end, yet none of these attitu
- Page 35 and 36:
make decisions. It cannot be volunt
- Page 37 and 38:
logs), data and video conferencing
- Page 39 and 40:
Ability to follow user’s multi-ta
- Page 41 and 42:
CONCLUSIONSEDUSA method gives us a
- Page 43 and 44:
in successful SD. Given this situat
- Page 45 and 46:
SPATIAL INFORMATIONFor the visualis
- Page 47 and 48:
MOBILE TECHNOLOGIES USE IN SERVICES
- Page 49 and 50:
learning environment (Learning Mana
- Page 51 and 52:
ago only some curricula on Logistic
- Page 53 and 54:
The Web-based version can be access
- Page 55 and 56:
Web-portal, which incorporates diff
- Page 57 and 58:
DO INTELLIGENT OBJECTS AUTOMATICALL
- Page 59 and 60:
Table 1. Examples for introducing R
- Page 61 and 62: workable influencing of the process
- Page 63 and 64: are handed over to the objects and
- Page 65 and 66: • Basic processes, such as wareho
- Page 67 and 68: THE ECR E-COACH: A VIRTUAL COACHING
- Page 69 and 70: participating in the workshops and
- Page 71 and 72: • Assessment modules enable indiv
- Page 73 and 74: with pictures and illustrated graph
- Page 75 and 76: ECR Question Banknumber category su
- Page 77 and 78: educational programme that follows
- Page 79 and 80: DEVELOPMENT OF WEB BASED GRAVITY MO
- Page 81 and 82: These results of a model require a
- Page 83 and 84: CONCLUSIONSThe main goal of work ha
- Page 85 and 86: dimension and included within any o
- Page 87 and 88: • Resources sharing by providing
- Page 89 and 90: Pursuant to the guidelines of elect
- Page 91 and 92: tariffs of regulated services have
- Page 93 and 94: INFORMATION TECHNOLOGY FOR MOTIVATI
- Page 95 and 96: difficult to predict when and for w
- Page 97 and 98: Listeners' workon the WebListenersS
- Page 99 and 100: PERSPECTIVES OF WEB PAGE AND E-MAIL
- Page 101 and 102: INCREASE IN THE NUMBER OF INTERNETU
- Page 103 and 104: tourism accommodations (home pages
- Page 105 and 106: interactive relationships with clie
- Page 107 and 108: • The data obtained by the resear
- Page 109 and 110: Central Statistical Bureau of Latvi
- Page 111: departures for 1995 are taken from
- Page 115 and 116: 140120maximumworldminimum1008060402
- Page 117 and 118: would be a promising extension. Cur
- Page 119 and 120: AN OVERVIEW OF THE AGENT − BASED
- Page 121 and 122: Suitability for social system simul
- Page 123 and 124: 6. MASONDescription:MASON is a fast
- Page 125 and 126: Suitability for social system simul
- Page 127 and 128: could be bad particularly when over
- Page 129 and 130: (for 10 repeat &| CCar[]->runfor);P
- Page 131 and 132: • Streaming audio• Collaboratio
- Page 133 and 134: NECESSITY OF NEW LAYERED APPROACH T
- Page 135 and 136: Up to now, there has only been limi
- Page 137 and 138: aaaaa6= −aa2,1 = − a0,3226= −
- Page 139 and 140: ∂ u∂x∂ u∂y2 2+ b = 02 2wher
- Page 141 and 142: a6,3= −2030a4,5−130a4,3- - - -
- Page 143 and 144: 0,10,20,30,4( )Mag x y y Ge wx2, =
- Page 145 and 146: Example 1. To understand better the
- Page 147 and 148: Therefore, further the following co
- Page 149 and 150: SOLUTION OF THE THREE-DIMENSIONALEQ
- Page 151 and 152: Mag1, m , m , m1 2 3= mm1 m2m32 2 2
- Page 153 and 154: MagMag0, m , m , m1 2 31, m , m , m
- Page 155: CONCLUSIONSThe basic content of thi