Proceedings in pdf format. - Sociotechnical Systems Engineering ...
Proceedings in pdf format. - Sociotechnical Systems Engineering ...
Proceedings in pdf format. - Sociotechnical Systems Engineering ...

Create successful ePaper yourself
Turn your PDF publications into a flip-book with our unique Google optimized e-Paper software.
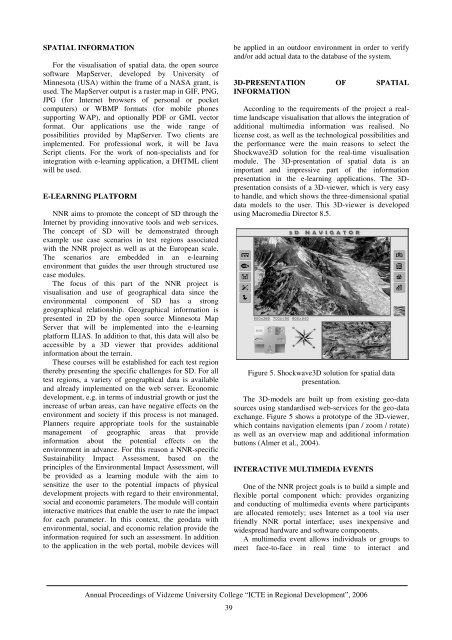
SPATIAL INFORMATIONFor the visualisation of spatial data, the open sourcesoftware MapServer, developed by University ofM<strong>in</strong>nesota (USA) with<strong>in</strong> the frame of a NASA grant, isused. The MapServer output is a raster map <strong>in</strong> GIF, PNG,JPG (for Internet browsers of personal or pocketcomputers) or WBMP <strong>format</strong>s (for mobile phonessupport<strong>in</strong>g WAP), and optionally PDF or GML vector<strong>format</strong>. Our applications use the wide range ofpossibilities provided by MapServer. Two clients areimplemented. For professional work, it will be JavaScript clients. For the work of non-specialists and for<strong>in</strong>tegration with e-learn<strong>in</strong>g application, a DHTML clientwill be used.E-LEARNING PLATFORMNNR aims to promote the concept of SD through theInternet by provid<strong>in</strong>g <strong>in</strong>novative tools and web services.The concept of SD will be demonstrated throughexample use case scenarios <strong>in</strong> test regions associatedwith the NNR project as well as at the European scale.The scenarios are embedded <strong>in</strong> an e-learn<strong>in</strong>genvironment that guides the user through structured usecase modules.The focus of this part of the NNR project isvisualisation and use of geographical data s<strong>in</strong>ce theenvironmental component of SD has a stronggeographical relationship. Geographical <strong>in</strong><strong>format</strong>ion ispresented <strong>in</strong> 2D by the open source M<strong>in</strong>nesota MapServer that will be implemented <strong>in</strong>to the e-learn<strong>in</strong>gplatform ILIAS. In addition to that, this data will also beaccessible by a 3D viewer that provides additional<strong>in</strong><strong>format</strong>ion about the terra<strong>in</strong>.These courses will be established for each test regionthereby present<strong>in</strong>g the specific challenges for SD. For alltest regions, a variety of geographical data is availableand already implemented on the web server. Economicdevelopment, e.g. <strong>in</strong> terms of <strong>in</strong>dustrial growth or just the<strong>in</strong>crease of urban areas, can have negative effects on theenvironment and society if this process is not managed.Planners require appropriate tools for the susta<strong>in</strong>ablemanagement of geographic areas that provide<strong>in</strong><strong>format</strong>ion about the potential effects on theenvironment <strong>in</strong> advance. For this reason a NNR-specificSusta<strong>in</strong>ability Impact Assessment, based on thepr<strong>in</strong>ciples of the Environmental Impact Assessment, willbe provided as a learn<strong>in</strong>g module with the aim tosensitize the user to the potential impacts of physicaldevelopment projects with regard to their environmental,social and economic parameters. The module will conta<strong>in</strong><strong>in</strong>teractive matrices that enable the user to rate the impactfor each parameter. In this context, the geodata withenvironmental, social, and economic relation provide the<strong>in</strong><strong>format</strong>ion required for such an assessment. In additionto the application <strong>in</strong> the web portal, mobile devices willbe applied <strong>in</strong> an outdoor environment <strong>in</strong> order to verifyand/or add actual data to the database of the system.3D-PRESENTATION OF SPATIALINFORMATIONAccord<strong>in</strong>g to the requirements of the project a realtimelandscape visualisation that allows the <strong>in</strong>tegration ofadditional multimedia <strong>in</strong><strong>format</strong>ion was realised. Nolicense cost, as well as the technological possibilities andthe performance were the ma<strong>in</strong> reasons to select theShockwave3D solution for the real-time visualisationmodule. The 3D-presentation of spatial data is animportant and impressive part of the <strong>in</strong><strong>format</strong>ionpresentation <strong>in</strong> the e-learn<strong>in</strong>g applications. The 3Dpresentationconsists of a 3D-viewer, which is very easyto handle, and which shows the three-dimensional spatialdata models to the user. This 3D-viewer is developedus<strong>in</strong>g Macromedia Director 8.5.Figure 5. Shockwave3D solution for spatial datapresentation.The 3D-models are built up from exist<strong>in</strong>g geo-datasources us<strong>in</strong>g standardised web-services for the geo-dataexchange. Figure 5 shows a prototype of the 3D-viewer,which conta<strong>in</strong>s navigation elements (pan / zoom / rotate)as well as an overview map and additional <strong>in</strong><strong>format</strong>ionbuttons (Almer et al., 2004).INTERACTIVE MULTIMEDIA EVENTSOne of the NNR project goals is to build a simple andflexible portal component which: provides organiz<strong>in</strong>gand conduct<strong>in</strong>g of multimedia events where participantsare allocated remotely; uses Internet as a tool via userfriendly NNR portal <strong>in</strong>terface; uses <strong>in</strong>expensive andwidespread hardware and software components.A multimedia event allows <strong>in</strong>dividuals or groups tomeet face-to-face <strong>in</strong> real time to <strong>in</strong>teract andAnnual <strong>Proceed<strong>in</strong>gs</strong> of Vidzeme University College “ICTE <strong>in</strong> Regional Development”, 200639