

Social Insurance and Public Assistance
public-assistance-welfare-reform-colonial-times-to-the-present-ziliak ...
public-assistance-welfare-reform-colonial-times-to-the-present-ziliak ...

Create successful ePaper yourself
Turn your PDF publications into a flip-book with our unique Google optimized e-Paper software.
702 Bf SOCIAL INSURANCE AND PUBLIC ASSISTANCE<br />
Percent<br />
20<br />
15<br />
10<br />
5<br />
0<br />
<strong>Public</strong><br />
Private<br />
(early method)<br />
Private<br />
1930 1940 1950 1960 1970 1980 1990<br />
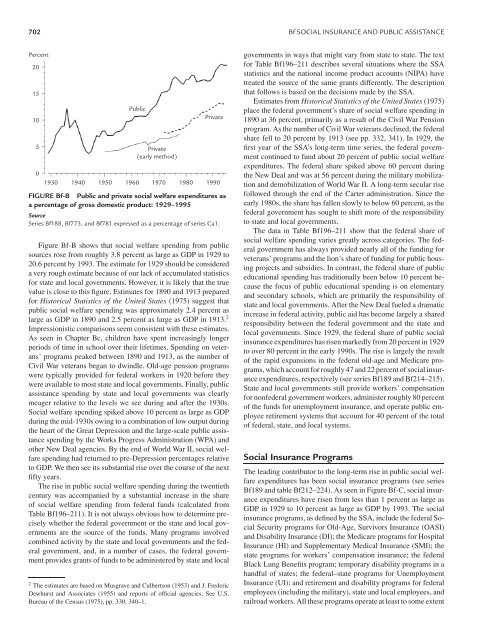
FIGURE Bf-B <strong>Public</strong> <strong>and</strong> private social welfare expenditures as<br />
a percentage of gross domestic product: 1929–1995<br />
Source<br />
Series Bf188, Bf773, <strong>and</strong> Bf781 expressed as a percentage of series Ca1.<br />
Figure Bf-B shows that social welfare spending from public<br />
sources rose from roughly 3.8 percent as large as GDP in 1929 to<br />
20.6 percent by 1993. The estimate for 1929 should be considered<br />
avery rough estimate because of our lack of accumulated statistics<br />
for state <strong>and</strong> local governments. However, it is likely that the true<br />
value is close to this figure. Estimates for 1890 <strong>and</strong> 1913 prepared<br />
for Historical Statistics of the United States (1975) suggest that<br />
public social welfare spending was approximately 2.4 percent as<br />
large as GDP in 1890 <strong>and</strong> 2.5 percent as large as GDP in 1913. 2<br />
Impressionistic comparisons seem consistent with these estimates.<br />
As seen in Chapter Bc, children have spent increasingly longer<br />
periods of time in school over their lifetimes. Spending on veterans’<br />
programs peaked between 1890 <strong>and</strong> 1913, as the number of<br />
Civil War veterans began to dwindle. Old-age pension programs<br />
were typically provided for federal workers in 1920 before they<br />
were available to most state <strong>and</strong> local governments. Finally, public<br />
assistance spending by state <strong>and</strong> local governments was clearly<br />
meager relative to the levels we see during <strong>and</strong> after the 1930s.<br />
<strong>Social</strong> welfare spending spiked above 10 percent as large as GDP<br />
during the mid-1930s owing to a combination of low output during<br />
the heart of the Great Depression <strong>and</strong> the large-scale public assistance<br />
spending by the Works Progress Administration (WPA) <strong>and</strong><br />
other New Deal agencies. By the end of World War II, social welfare<br />
spending had returned to pre-Depression percentages relative<br />
to GDP. We then see its substantial rise over the course of the next<br />
fifty years.<br />
The rise in public social welfare spending during the twentieth<br />
century was accompanied by a substantial increase in the share<br />
of social welfare spending from federal funds (calculated from<br />
Table Bf196–211). It is not always obvious how to determine precisely<br />
whether the federal government or the state <strong>and</strong> local governments<br />
are the source of the funds. Many programs involved<br />
combined activity by the state <strong>and</strong> local governments <strong>and</strong> the federal<br />
government, <strong>and</strong>, in a number of cases, the federal government<br />
provides grants of funds to be administered by state <strong>and</strong> local<br />
2 The estimates are based on Musgrave <strong>and</strong> Culbertson (1953) <strong>and</strong> J. Frederic<br />
Dewhurst <strong>and</strong> Associates (1955) <strong>and</strong> reports of official agencies. See U.S.<br />
Bureau of the Census (1975), pp. 330, 340–1.<br />
governments in ways that might vary from state to state. The text<br />
for Table Bf196–211 describes several situations where the SSA<br />
statistics <strong>and</strong> the national income product accounts (NIPA) have<br />
treated the source of the same grants differently. The description<br />
that follows is based on the decisions made by the SSA.<br />
Estimates from Historical Statistics of the United States (1975)<br />
place the federal government’s share of social welfare spending in<br />
1890 at 36 percent, primarily as a result of the Civil War Pension<br />
program. As the number of Civil War veterans declined, the federal<br />
share fell to 20 percent by 1913 (see pp. 332, 341). In 1929, the<br />
first year of the SSA’s long-term time series, the federal government<br />
continued to fund about 20 percent of public social welfare<br />
expenditures. The federal share spiked above 60 percent during<br />
the New Deal <strong>and</strong> was at 56 percent during the military mobilization<br />
<strong>and</strong> demobilization of World War II. A long-term secular rise<br />
followed through the end of the Carter administration. Since the<br />
early 1980s, the share has fallen slowly to below 60 percent, as the<br />
federal government has sought to shift more of the responsibility<br />
to state <strong>and</strong> local governments.<br />
The data in Table Bf196–211 show that the federal share of<br />
social welfare spending varies greatly across categories. The federal<br />
government has always provided nearly all of the funding for<br />
veterans’ programs <strong>and</strong> the lion’s share of funding for public housing<br />
projects <strong>and</strong> subsidies. In contrast, the federal share of public<br />
educational spending has traditionally been below 10 percent because<br />
the focus of public educational spending is on elementary<br />
<strong>and</strong> secondary schools, which are primarily the responsibility of<br />
state <strong>and</strong> local governments. After the New Deal fueled a dramatic<br />
increase in federal activity, public aid has become largely a shared<br />
responsibility between the federal government <strong>and</strong> the state <strong>and</strong><br />
local governments. Since 1929, the federal share of public social<br />
insurance expenditures has risen markedly from 20 percent in 1929<br />
to over 80 percent in the early 1990s. The rise is largely the result<br />
of the rapid expansions in the federal old-age <strong>and</strong> Medicare programs,<br />
which account for roughly 47 <strong>and</strong> 22 percent of social insurance<br />
expenditures, respectively (see series Bf189 <strong>and</strong> Bf214–215).<br />
State <strong>and</strong> local governments still provide workers’ compensation<br />
for nonfederal government workers, administer roughly 80 percent<br />
of the funds for unemployment insurance, <strong>and</strong> operate public employee<br />
retirement systems that account for 40 percent of the total<br />
of federal, state, <strong>and</strong> local systems.<br />
<strong>Social</strong> <strong>Insurance</strong> Programs<br />
The leading contributor to the long-term rise in public social welfare<br />
expenditures has been social insurance programs (see series<br />
Bf189 <strong>and</strong> table Bf212–224). As seen in Figure Bf-C, social insurance<br />
expenditures have risen from less than 1 percent as large as<br />
GDP in 1929 to 10 percent as large as GDP by 1993. The social<br />
insurance programs, as defined by the SSA, include the federal <strong>Social</strong><br />
Security programs for Old-Age, Survivors <strong>Insurance</strong> (OASI)<br />
<strong>and</strong> Disability <strong>Insurance</strong> (DI); the Medicare programs for Hospital<br />
<strong>Insurance</strong> (HI) <strong>and</strong> Supplementary Medical <strong>Insurance</strong> (SMI); the<br />
state programs for workers’ compensation insurance; the federal<br />
Black Lung Benefits program; temporary disability programs in a<br />
h<strong>and</strong>ful of states; the federal–state programs for Unemployment<br />
<strong>Insurance</strong> (UI); <strong>and</strong> retirement <strong>and</strong> disability programs for federal<br />
employees (including the military), state <strong>and</strong> local employees, <strong>and</strong><br />
railroad workers. All these programs operate at least to some extent


