

Social Insurance and Public Assistance
public-assistance-welfare-reform-colonial-times-to-the-present-ziliak ...
public-assistance-welfare-reform-colonial-times-to-the-present-ziliak ...

You also want an ePaper? Increase the reach of your titles
YUMPU automatically turns print PDFs into web optimized ePapers that Google loves.
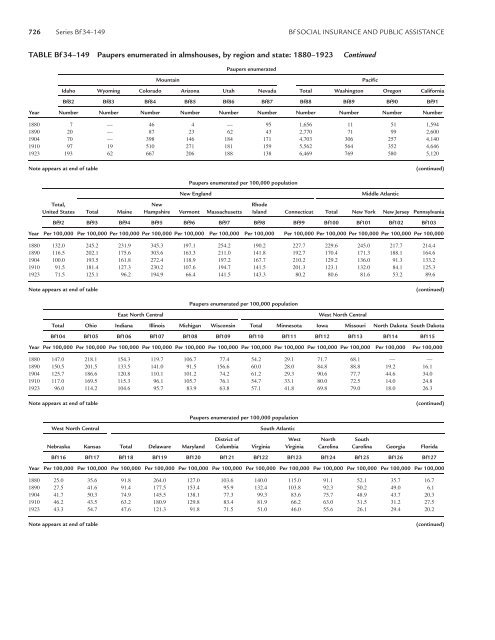
726 Series Bf 34–149 Bf SOCIAL INSURANCE AND PUBLIC ASSISTANCE<br />
TABLE Bf 34–149 Paupers enumerated in almshouses, by region <strong>and</strong> state: 1880–1923 Continued<br />
Mountain<br />
Paupers enumerated<br />
Idaho Wyoming Colorado Arizona Utah Nevada Total Washington Oregon California<br />
Bf82 Bf83 Bf84 Bf85 Bf86 Bf87 Bf88 Bf89 Bf90 Bf91<br />
Year Number Number Number Number Number Number Number Number Number Number<br />
1880 7 — 46 4 — 95 1,656 11 51 1,594<br />
1890 20 — 87 23 62 43 2,770 71 99 2,600<br />
1904 70 — 398 146 184 171 4,703 306 257 4,140<br />
1910 97 19 510 271 181 159 5,562 564 352 4,646<br />
1923 193 62 667 206 188 138 6,469 769 580 5,120<br />
Pacific<br />
Note appears at end of table<br />
(continued)<br />
Paupers enumerated per 100,000 population<br />
New Engl<strong>and</strong><br />
Middle Atlantic<br />
Total, New Rhode<br />
United States Total Maine Hampshire Vermont Massachusetts Isl<strong>and</strong> Connecticut Total New York New Jersey Pennsylvania<br />
Bf92 Bf93 Bf94 Bf95 Bf96 Bf97 Bf98 Bf99 Bf100 Bf101 Bf102 Bf103<br />
Year Per 100,000 Per 100,000 Per 100,000 Per 100,000 Per 100,000 Per 100,000 Per 100,000 Per 100,000 Per 100,000 Per 100,000 Per 100,000 Per 100,000<br />
1880 132.0 245.2 231.9 345.3 197.1 254.2 190.2 227.7 229.6 245.0 217.7 214.4<br />
1890 116.5 202.1 175.6 303.6 163.3 211.0 141.8 192.7 170.4 171.3 188.1 164.6<br />
1904 100.0 193.5 161.8 272.4 118.9 197.2 167.7 210.2 129.2 136.0 91.3 133.2<br />
1910 91.5 181.4 127.3 230.2 107.6 194.7 141.5 201.3 123.1 132.0 84.1 125.3<br />
1923 71.5 125.1 96.2 194.9 66.4 141.5 143.3 80.2 80.6 81.6 53.2 89.6<br />
Note appears at end of table<br />
(continued)<br />
Paupers enumerated per 100,000 population<br />
East North Central<br />
West North Central<br />
Total Ohio Indiana Illinois Michigan Wisconsin Total Minnesota Iowa Missouri North Dakota South Dakota<br />
Bf104 Bf105 Bf106 Bf107 Bf108 Bf109 Bf110 Bf111 Bf112 Bf113 Bf114 Bf115<br />
Year Per 100,000 Per 100,000 Per 100,000 Per 100,000 Per 100,000 Per 100,000 Per 100,000 Per 100,000 Per 100,000 Per 100,000 Per 100,000 Per 100,000<br />
1880 147.0 218.1 154.3 119.7 106.7 77.4 54.2 29.1 71.7 68.1 — —<br />
1890 150.5 201.5 133.5 141.0 91.5 156.6 60.0 28.0 84.8 88.8 19.2 16.1<br />
1904 125.7 186.6 120.8 110.1 101.2 74.2 61.2 29.3 90.6 77.7 44.6 34.0<br />
1910 117.0 169.5 115.3 96.1 105.7 76.1 54.7 33.1 80.0 72.5 14.0 24.8<br />
1923 96.0 114.2 104.6 95.7 83.9 63.8 57.1 41.8 69.8 79.0 18.0 26.3<br />
Note appears at end of table<br />
(continued)<br />
West North Central<br />
Paupers enumerated per 100,000 population<br />
South Atlantic<br />
District of West North South<br />
Nebraska Kansas Total Delaware Maryl<strong>and</strong> Columbia Virginia Virginia Carolina Carolina Georgia Florida<br />
Bf116 Bf117 Bf118 Bf119 Bf120 Bf121 Bf122 Bf123 Bf124 Bf125 Bf126 Bf127<br />
Year Per 100,000 Per 100,000 Per 100,000 Per 100,000 Per 100,000 Per 100,000 Per 100,000 Per 100,000 Per 100,000 Per 100,000 Per 100,000 Per 100,000<br />
1880 25.0 35.6 91.8 264.0 127.0 103.6 140.0 115.0 91.1 52.1 35.7 16.7<br />
1890 27.5 41.6 91.4 177.5 153.4 95.9 132.4 103.8 92.3 50.2 49.0 6.1<br />
1904 41.7 50.3 74.9 145.5 138.1 77.3 99.3 83.6 75.7 48.9 43.7 20.3<br />
1910 46.2 43.5 63.2 180.9 129.8 83.4 81.9 66.2 63.0 31.5 31.2 27.5<br />
1923 43.3 54.7 47.6 121.3 91.8 71.5 51.0 46.0 55.6 26.1 29.4 20.2<br />
Note appears at end of table<br />
(continued)


