

Social Insurance and Public Assistance
public-assistance-welfare-reform-colonial-times-to-the-present-ziliak ...
public-assistance-welfare-reform-colonial-times-to-the-present-ziliak ...

You also want an ePaper? Increase the reach of your titles
YUMPU automatically turns print PDFs into web optimized ePapers that Google loves.
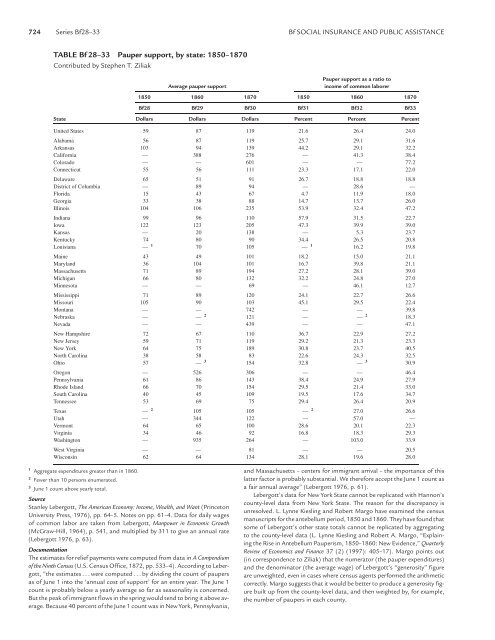
724 Series Bf28–33 Bf SOCIAL INSURANCE AND PUBLIC ASSISTANCE<br />
TABLE Bf 28–33 Pauper support, by state: 1850–1870<br />
Contributed by Stephen T. Ziliak<br />
Average pauper support<br />
Pauper support as a ratio to<br />
income of common laborer<br />
1850 1860 1870 1850 1860 1870<br />
Bf28 Bf29 Bf30 Bf31 Bf32 Bf33<br />
State Dollars Dollars Dollars Percent Percent Percent<br />
United States 59 87 119 21.6 26.4 24.0<br />
Alabama 56 87 119 25.7 29.1 31.6<br />
Arkansas 103 94 139 44.2 29.1 32.2<br />
California — 388 276 — 41.3 38.4<br />
Colorado — — 601 — — 77.2<br />
Connecticut 55 56 111 23.3 17.1 22.0<br />
Delaware 65 51 91 26.7 18.8 18.8<br />
District of Columbia — 89 94 — 28.6 —<br />
Florida 15 43 67 4.7 11.9 18.0<br />
Georgia 33 38 88 14.7 13.7 26.0<br />
Illinois 104 106 235 53.9 32.4 47.2<br />
Indiana 99 96 110 57.9 31.5 22.7<br />
Iowa 122 123 205 47.3 39.9 39.0<br />
Kansas — 20 138 — 5.3 23.7<br />
Kentucky 74 80 90 34.4 26.5 20.8<br />
Louisiana — 1 70 105 — 1 16.2 19.8<br />
Maine 43 49 101 18.2 15.0 21.1<br />
Maryl<strong>and</strong> 36 104 101 16.7 39.8 21.1<br />
Massachusetts 71 89 194 27.2 28.1 39.0<br />
Michigan 66 80 132 32.2 24.8 27.0<br />
Minnesota — — 69 — 46.1 12.7<br />
Mississippi 71 89 120 24.1 22.7 26.6<br />
Missouri 105 90 103 45.1 29.5 22.4<br />
Montana — — 742 — — 39.8<br />
Nebraska — — 2 121 — — 2 18.3<br />
Nevada — — 439 — — 47.1<br />
New Hampshire 72 67 110 36.7 22.9 27.2<br />
New Jersey 59 71 119 29.2 21.3 23.3<br />
New York 64 75 189 30.8 23.7 40.5<br />
North Carolina 38 58 83 22.6 24.3 32.5<br />
Ohio 57 — 3 154 32.8 — 3 30.9<br />
Oregon — 526 306 — — 46.4<br />
Pennsylvania 61 86 143 38.4 24.9 27.9<br />
Rhode Isl<strong>and</strong> 66 70 154 29.5 21.4 33.0<br />
South Carolina 40 45 109 19.5 17.6 34.7<br />
Tennessee 53 69 75 29.4 26.4 20.9<br />
Texas — 2 105 105 — 2 27.0 26.6<br />
Utah — 344 122 — 57.0 —<br />
Vermont 64 65 100 28.6 20.1 22.3<br />
Virginia 34 46 92 16.8 18.3 29.3<br />
Washington — 935 264 — 103.0 33.9<br />
West Virginia — — 81 — — 20.5<br />
Wisconsin 62 64 134 28.1 19.6 28.0<br />
1 Aggregate expenditures greater than in 1860.<br />
2 Fewer than 10 persons enumerated.<br />
3 June 1 count above yearly total.<br />
Source<br />
Stanley Lebergott, The American Economy: Income, Wealth, <strong>and</strong> Want (Princeton<br />
University Press, 1976), pp. 64–5. Notes on pp. 61–4. Data for daily wages<br />
of common labor are taken from Lebergott, Manpower in Economic Growth<br />
(McGraw-Hill, 1964), p. 541, <strong>and</strong> multiplied by 311 to give an annual rate<br />
(Lebergott 1976, p. 63).<br />
Documentation<br />
The estimates for relief payments were computed from data in A Compendium<br />
of the Ninth Census (U.S. Census Office, 1872, pp. 533–4). According to Lebergott,<br />
“the estimates ...were computed . . . by dividing the count of paupers<br />
as of June 1 into the ‘annual cost of support’ for an entire year. The June 1<br />
count is probably below a yearly average so far as seasonality is concerned.<br />
But the peak of immigrant flows in the spring would tend to bring it above average.<br />
Because 40 percent of the June 1 count was in New York, Pennsylvania,<br />
<strong>and</strong> Massachusetts – centers for immigrant arrival – the importance of this<br />
latter factor is probably substantial. We therefore accept the June 1 count as<br />
afair annual average” (Lebergott 1976, p. 61).<br />
Lebergott’s data for New York State cannot be replicated with Hannon’s<br />
county-level data from New York State. The reason for the discrepancy is<br />
unresolved. L. Lynne Kiesling <strong>and</strong> Robert Margo have examined the census<br />
manuscripts for the antebellum period, 1850 <strong>and</strong> 1860. They have found that<br />
some of Lebergott’s other state totals cannot be replicated by aggregating<br />
to the county-level data (L. Lynne Kiesling <strong>and</strong> Robert A. Margo, “Explaining<br />
the Rise in Antebellum Pauperism, 1850–1860: New Evidence,” Quarterly<br />
Review of Economics <strong>and</strong> Finance 37 (2) (1997): 405–17). Margo points out<br />
(in correspondence to Ziliak) that the numerator (the pauper expenditures)<br />
<strong>and</strong> the denominator (the average wage) of Lebergott’s “generosity” figure<br />
are unweighted, even in cases where census agents performed the arithmetic<br />
correctly. Margo suggests that it would be better to produce a generosity figure<br />
built up from the county-level data, <strong>and</strong> then weighted by, for example,<br />
the number of paupers in each county.


