

Social Insurance and Public Assistance
public-assistance-welfare-reform-colonial-times-to-the-present-ziliak ...
public-assistance-welfare-reform-colonial-times-to-the-present-ziliak ...

Create successful ePaper yourself
Turn your PDF publications into a flip-book with our unique Google optimized e-Paper software.
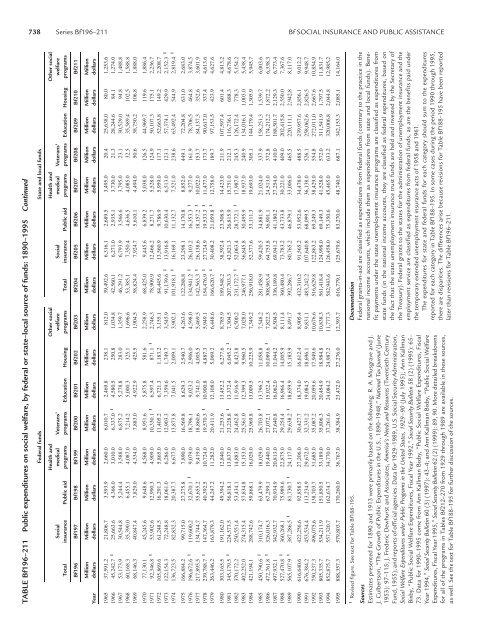
738 Series Bf196–211 Bf SOCIAL INSURANCE AND PUBLIC ASSISTANCE<br />
TABLE Bf196–211 <strong>Public</strong> expenditures on social welfare, by federal or state–local source of funds: 1890–1995 Continued<br />
Federal funds State <strong>and</strong> local funds<br />
Health <strong>and</strong> Other social Health <strong>and</strong> Other social<br />
<strong>Social</strong> medical Veterans’ welfare <strong>Social</strong> medical Veterans’ welfare<br />
Total insurance <strong>Public</strong> aid programs programs Education Housing programs Total insurance <strong>Public</strong> aid programs programs Education Housing programs<br />
Bf196 Bf197 Bf198 Bf199 Bf200 Bf201 Bf202 Bf203 Bf204 Bf205 Bf206 Bf207 Bf208 Bf209 Bf210 Bf211<br />
Million Million Million Million Million Million Million Million Million Million Million Million Million Million Million Million<br />
Year dollars dollars dollars dollars dollars dollars dollars dollars dollars dollars dollars dollars dollars dollars dollars dollars<br />
1965 37,591.2 21,806.7 3,593.9 2,660.0 6,010.7 2,469.8 238.1 812.0 39,492.6 6,316.1 2,689.5 3,495.0 20.4 25,638.0 80.0 1,253.6<br />
1966 45,242.7 1 25,663.6 4,366.0 3,010.0 6,337.0 1 4,580.5 250.8 1,034.8 42,560.1 6,271.0 2,935.1 3,730.0 21.3 28,244.6 84.1 1,274.0<br />
1967 53,173.9 30,544.8 5,244.4 3,588.0 6,875.2 5,278.8 283.0 1,359.7 46,291.2 6,793.9 3,566.6 3,795.0 23.1 30,529.0 94.8 1,488.8<br />
1968 60,168.3 35,390.0 6,455.1 4,087.0 7,214.2 5,000.3 325.1 1,696.6 53,385.1 7,350.4 4,636.5 4,085.0 32.5 35,589.4 102.5 1,588.8<br />
1969 68,146.3 40,847.4 7,829.0 4,334.0 7,883.0 4,922.9 425.5 1,904.5 58,824.4 7,924.7 5,610.1 4,494.0 50.6 38,750.2 106.8 1,888.0<br />
1970 77,130.1 45,245.6 9,648.6 4,568.0 8,951.6 5,875.8 581.6 2,258.9 68,425.0 9,445.6 6,839.2 5,038.0 126.5 44,969.7 119.6 1,886.4<br />
1971 92,346.8 1 53,902.6 12,990.3 4,909.0 10,330.1 1 6,597.4 871.1 1 2,746.3 78,909.9 12,466.2 8,271.7 5,528.0 124.9 50,107.3 175.1 2,236.7<br />
1972 105,869.6 61,248.5 16,291.3 5,865.0 11,405.2 6,721.3 1,183.2 3,155.1 84,445.6 13,560.9 9,786.9 5,959.0 117.1 52,663.8 149.2 2,208.7<br />
1973 122,154.3 72,248.8 18,061.0 6,286.0 12,903.3 7,359.6 1,749.7 3,545.9 91,139.6 1 13,916.8 10,630.4 6,513.0 123.1 57,374.1 429.9 2,152.3 1<br />
1974 136,723.5 82,832.3 20,387.7 6,677.0 13,873.8 7,041.5 2,009.1 3,902.1 101,918.1 1 16,169.1 11,132.7 7,521.0 238.6 63,492.4 544.9 2,819.4 1<br />
1975 166,884.2 99,715.0 27,275.8 7,890.0 16,569.8 8,629.3 2,540.7 4,263.6 122,288.8 23,298.1 14,170.8 8,852.0 449.1 72,204.8 631.0 2,683.0<br />
1976 196,672.6 1 119,600.2 32,670.1 1 9,079.0 18,796.1 9,023.2 2,906.0 4,598.0 134,941.2 1 26,103.2 16,353.3 1 9,277.0 161.9 78,706.5 464.8 3,874.5<br />
1977 217,895.5 134,744.7 35,655.2 9,419.0 18,860.6 9,741.0 4,005.5 5,469.5 142,563.3 1 26,138.6 18,157.2 1 10,022.0 153.7 84,137.3 352.6 3,601.9<br />
1978 239,788.7 1 147,364.7 40,392.5 10,724.0 19,570.3 1 10,900.8 4,887.3 5,949.1 154,476.9 1 27,724.9 19,533.3 1 11,477.0 173.7 90,617.0 337.4 4,613.6<br />
1979 263,446.2 163,879.3 44,247.2 11,282.0 20,411.9 12,108.0 5,069.2 6,448.6 166,620.7 1 30,408.2 21,059.8 1 12,758.0 189.7 97,153.5 423.9 4,627.6<br />
1980 303,165.5 191,162.0 49,394.2 12,840.0 21,253.6 13,452.2 6,277.6 8,785.9 189,548.2 38,592.4 23,308.9 14,423.0 211.9 107,597.4 601.4 4,813.2<br />
1981 345,179.5 1 224,573.5 56,818.1 13,837.0 23,228.8 1 13,372.4 6,045.2 1 7,304.5 207,703.3 42,821.3 26,815.9 15,751.0 212.1 116,736.1 688.3 4,678.6<br />
1982 370,172.2 250,551.4 53,434.1 14,883.0 24,462.8 11,916.9 8,423.8 6,500.2 231,172.7 1 52,063.4 28,772.1 1 17,987.0 245.3 126,172.4 778.3 5,154.2<br />
1983 402,252.0 274,315.4 57,834.8 15,153.0 25,561.0 12,399.3 9,960.5 7,028.0 246,977.1 56,845.8 30,495.9 18,937.0 240.9 134,016.1 1,003.0 5,438.4<br />
1984 421,194.1 288,742.6 59,868.1 16,029.0 25,969.8 13,009.5 10,225.9 7,349.2 256,918.0 52,377.6 33,111.3 19,693.0 305.1 144,179.4 1,305.9 5,945.7<br />
1985 450,790.6 1 310,174.7 63,479.9 18,029.0 26,703.8 1 13,796.2 11,058.8 7,548.2 281,458.9 59,420.5 34,881.9 21,024.0 337.9 158,251.3 1,539.7 6,003.6<br />
1986 472,761.8 1 326,016.3 67,299.1 19,440.0 27,072.1 15,022.4 10,089.6 1 7,822.3 308,963.4 64,753.8 36,901.1 24,513.0 372.8 174,212.2 1,872.2 6,338.3<br />
1987 497,932.1 342,932.7 70,934.9 20,813.0 27,640.8 16,062.0 11,044.2 8,504.5 336,189.8 69,941.2 41,180.2 27,254.0 410.0 188,501.7 2,129.3 6,773.4<br />
1988 527,470.8 1 360,268.1 75,989.6 22,875.0 29,254.4 16,966.4 14,005.9 8,111.4 360,480.4 73,783.2 43,733.8 30,221.0 409.0 202,415.8 2,550.0 7,367.6<br />
1989 565,107.9 1 387,286.5 1 81,730.7 1 24,117.0 29,638.2 1 18,659.9 15,183.9 8,491.7 392,286.7 80,765.2 46,879.1 33,006.0 465.5 220,111.1 2,942.8 8,117.0<br />
1990 616,640.6 422,256.6 92,858.5 27,206.0 30,427.7 18,374.0 16,612.4 8,905.4 432,310.2 91,565.2 53,952.6 34,478.0 488.5 239,957.6 2,856.1 9,012.2<br />
1991 676,384.2 453,534.4 113,234.9 29,672.0 32,331.2 19,084.5 18,696.1 9,831.1 483,242.2 107,640.8 68,099.5 36,138.0 526.1 258,062.6 2,826.5 9,948.7<br />
1992 750,237.3 496,075.6 138,703.7 31,685.0 35,087.2 20,059.6 17,949.6 10,676.6 516,629.8 122,863.2 69,249.3 38,429.0 554.8 272,011.0 2,667.6 10,854.9<br />
1993 805,335.7 534,211.9 151,850.5 33,189.0 35,806.3 20,454.9 18,984.8 10,838.3 561,418.4 124,998.0 69,149.3 41,528.0 572.0 311,541.9 1,797.5 11,831.7<br />
1994 852,875.7 557,320.7 162,674.7 34,770.0 37,261.6 24,084.2 24,987.2 11,777.3 582,943.6 126,458.0 75,350.6 45,465.0 633.2 320,006.8 2,044.8 12,985.2<br />
1995 888,357.3 579,803.7 170,260.0 36,767.0 38,384.9 23,472.0 27,276.0 12,393.7 616,779.1 125,679.6 83,270.0 48,740.0 687.1 342,153.3 2,085.1 14,164.0<br />
1 Revised figure. See text for Table Bf188–195.<br />
Sources<br />
Estimates presented for 1890 <strong>and</strong> 1913 were primarily based on the following: R. A. Musgrave <strong>and</strong> J.<br />
J. Culbertson, “The Growth of <strong>Public</strong> Expenditures in the U.S., 1890–1948,” National Tax Journal (June<br />
1953): 97–115; J. Frederic Dewhurst <strong>and</strong> Associates, America’s Needs <strong>and</strong> Resources (Twentieth Century<br />
Fund, 1955); <strong>and</strong> reports of official agencies. Data for 1929–1989, U.S. <strong>Social</strong> Security Administration,<br />
<strong>Social</strong> Welfare Expenditures under <strong>Public</strong> Programs in the United States, 1929–90 (July 1995); Ann Kallman<br />
Bixby, “<strong>Public</strong> <strong>Social</strong> Welfare Expenditures, Fiscal Year 1992,” <strong>Social</strong> Security Bulletin 58 (2) (1995): 65–<br />
73. Data for 1990–1995 come from Ann Kallman Bixby, “<strong>Public</strong> <strong>Social</strong> Welfare Expenditures, Fiscal<br />
Year 1994,” <strong>Social</strong> Security Bulletin 60 (3) (1997): 43–4; <strong>and</strong> Ann Kallman Bixby, “<strong>Public</strong> <strong>Social</strong> Welfare<br />
Expenditures, Fiscal Year 1995,” <strong>Social</strong> Security Bulletin 62 (2) (1999): 89, 90. More detailed breakdowns<br />
for all of the programs in Tables Bf212–270 from 1929 through 1989 are available in these sources,<br />
as well. See the text for Table Bf188–195 for further discussion of the sources.<br />
Documentation<br />
Federal grants-in-aid are classified as expenditures from federal funds (contrary to the practice in the<br />
national income accounts, which include them as expenditures from state <strong>and</strong> local funds). Benefit<br />
payments under the state unemployment insurance programs are classified as expenditures from<br />
state funds (in the national income accounts, they are classified as federal expenditures, based on<br />
the fact that the state unemployment insurance trust funds are held <strong>and</strong> invested by the Secretary of<br />
the Treasury). Federal grants to the states for the administration of unemployment insurance <strong>and</strong> the<br />
employment service are classified as expenditures from federal funds, as are the benefits paid under<br />
the temporary extended unemployment insurance acts of 1958 <strong>and</strong> 1961.<br />
The expenditures for state <strong>and</strong> federal funds for each category should sum to the expenditures<br />
reported for each category in Table Bf188–195. In some cases during the period 1990 through 1995,<br />
there are disparities. The differences arise because revisions for Table Bf188–195 have been reported<br />
later than revisions for Table Bf196–211.


