

Social Insurance and Public Assistance
public-assistance-welfare-reform-colonial-times-to-the-present-ziliak ...
public-assistance-welfare-reform-colonial-times-to-the-present-ziliak ...

Create successful ePaper yourself
Turn your PDF publications into a flip-book with our unique Google optimized e-Paper software.
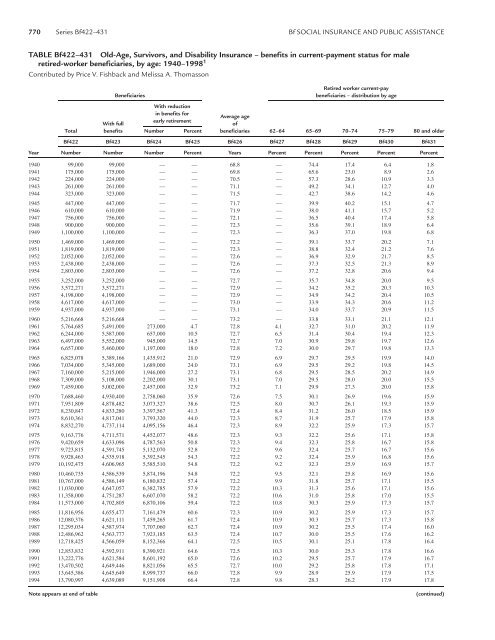
770 Series Bf422–431 Bf SOCIAL INSURANCE AND PUBLIC ASSISTANCE<br />
TABLE Bf422–431 Old-Age, Survivors, <strong>and</strong> Disability <strong>Insurance</strong> – benefits in current-payment status for male<br />
retired-worker beneficiaries, by age: 1940–1998 1<br />
Contributed by Price V. Fishback <strong>and</strong> Melissa A. Thomasson<br />
Beneficiaries<br />
Retired worker current-pay<br />
beneficiaries – distribution by age<br />
With reduction<br />
in benefits for<br />
Average age<br />
early retirement<br />
With full<br />
of<br />
Total benefits Number Percent beneficiaries 62–64 65–69 70–74 75–79 80 <strong>and</strong> older<br />
Bf422 Bf423 Bf424 Bf425 Bf426 Bf427 Bf428 Bf429 Bf430 Bf431<br />
Year Number Number Number Percent Years Percent Percent Percent Percent Percent<br />
1940 99,000 99,000 — — 68.8 — 74.4 17.4 6.4 1.8<br />
1941 175,000 175,000 — — 69.8 — 65.6 23.0 8.9 2.6<br />
1942 224,000 224,000 — — 70.5 — 57.3 28.6 10.9 3.3<br />
1943 261,000 261,000 — — 71.1 — 49.2 34.1 12.7 4.0<br />
1944 323,000 323,000 — — 71.5 — 42.7 38.6 14.2 4.6<br />
1945 447,000 447,000 — — 71.7 — 39.9 40.2 15.1 4.7<br />
1946 610,000 610,000 — — 71.9 — 38.0 41.1 15.7 5.2<br />
1947 756,000 756,000 — — 72.1 — 36.5 40.4 17.4 5.8<br />
1948 900,000 900,000 — — 72.3 — 35.6 39.1 18.9 6.4<br />
1949 1,100,000 1,100,000 — — 72.3 — 36.3 37.0 19.8 6.8<br />
1950 1,469,000 1,469,000 — — 72.2 — 39.1 33.7 20.2 7.1<br />
1951 1,819,000 1,819,000 — — 72.3 — 38.8 32.4 21.2 7.6<br />
1952 2,052,000 2,052,000 — — 72.6 — 36.9 32.9 21.7 8.5<br />
1953 2,438,000 2,438,000 — — 72.6 — 37.3 32.5 21.3 8.9<br />
1954 2,803,000 2,803,000 — — 72.6 — 37.2 32.8 20.6 9.4<br />
1955 3,252,000 3,252,000 — — 72.7 — 35.7 34.8 20.0 9.5<br />
1956 3,572,271 3,572,271 — — 72.9 — 34.2 35.2 20.3 10.3<br />
1957 4,198,000 4,198,000 — — 72.9 — 34.9 34.2 20.4 10.5<br />
1958 4,617,000 4,617,000 — — 73.0 — 33.9 34.3 20.6 11.2<br />
1959 4,937,000 4,937,000 — — 73.1 — 34.0 33.7 20.9 11.5<br />
1960 5,216,668 5,216,668 — — 73.2 — 33.8 33.1 21.1 12.1<br />
1961 5,764,685 5,491,000 273,000 4.7 72.8 4.1 32.7 31.0 20.2 11.9<br />
1962 6,244,000 5,587,000 657,000 10.5 72.7 6.5 31.4 30.4 19.4 12.3<br />
1963 6,497,000 5,552,000 945,000 14.5 72.7 7.0 30.9 29.8 19.7 12.6<br />
1964 6,657,000 5,460,000 1,197,000 18.0 72.8 7.2 30.0 29.7 19.8 13.3<br />
1965 6,825,078 5,389,166 1,435,912 21.0 72.9 6.9 29.7 29.5 19.9 14.0<br />
1966 7,034,000 5,345,000 1,689,000 24.0 73.1 6.9 29.5 29.2 19.8 14.5<br />
1967 7,160,000 5,215,000 1,946,000 27.2 73.1 6.8 29.5 28.5 20.2 14.9<br />
1968 7,309,000 5,108,000 2,202,000 30.1 73.1 7.0 29.5 28.0 20.0 15.5<br />
1969 7,459,000 5,002,000 2,457,000 32.9 73.2 7.1 29.9 27.3 20.0 15.8<br />
1970 7,688,460 4,930,400 2,758,060 35.9 72.6 7.5 30.1 26.9 19.6 15.9<br />
1971 7,951,809 4,878,482 3,073,327 38.6 72.5 8.0 30.7 26.1 19.3 15.9<br />
1972 8,230,847 4,833,280 3,397,567 41.3 72.4 8.4 31.2 26.0 18.5 15.9<br />
1973 8,610,361 4,817,041 3,793,320 44.0 72.3 8.7 31.9 25.7 17.9 15.8<br />
1974 8,832,270 4,737,114 4,095,156 46.4 72.3 8.9 32.2 25.9 17.3 15.7<br />
1975 9,163,776 4,711,571 4,452,077 48.6 72.3 9.3 32.2 25.6 17.1 15.8<br />
1976 9,420,659 4,633,096 4,787,563 50.8 72.3 9.4 32.3 25.8 16.7 15.8<br />
1977 9,723,815 4,591,745 5,132,070 52.8 72.2 9.6 32.4 25.7 16.7 15.6<br />
1978 9,928,463 4,535,918 5,392,545 54.3 72.2 9.2 32.4 25.9 16.8 15.6<br />
1979 10,192,475 4,606,965 5,585,510 54.8 72.2 9.2 32.3 25.9 16.9 15.7<br />
1980 10,460,735 4,586,539 5,874,196 54.8 72.2 9.5 32.1 25.8 16.9 15.6<br />
1981 10,767,000 4,586,149 6,180,832 57.4 72.2 9.9 31.8 25.7 17.1 15.5<br />
1982 11,030,000 4,647,057 6,382,785 57.9 72.2 10.3 31.3 25.6 17.1 15.6<br />
1983 11,358,000 4,751,287 6,607,070 58.2 72.2 10.6 31.0 25.8 17.0 15.5<br />
1984 11,573,000 4,702,805 6,870,106 59.4 72.2 10.8 30.3 25.9 17.3 15.7<br />
1985 11,816,956 4,655,477 7,161,479 60.6 72.3 10.9 30.2 25.9 17.3 15.7<br />
1986 12,080,376 4,621,111 7,459,265 61.7 72.4 10.9 30.3 25.7 17.3 15.8<br />
1987 12,295,034 4,587,974 7,707,060 62.7 72.4 10.9 30.2 25.5 17.4 16.0<br />
1988 12,486,962 4,563,777 7,923,185 63.5 72.4 10.7 30.0 25.5 17.6 16.2<br />
1989 12,718,425 4,566,059 8,152,366 64.1 72.5 10.5 30.1 25.1 17.8 16.4<br />
1990 12,853,832 4,592,911 8,390,921 64.6 72.5 10.3 30.0 25.3 17.8 16.6<br />
1991 13,222,776 4,621,584 8,601,192 65.0 72.6 10.2 29.5 25.7 17.9 16.7<br />
1992 13,470,502 4,649,446 8,821,056 65.5 72.7 10.0 29.2 25.8 17.8 17.1<br />
1993 13,645,386 4,645,649 8,999,737 66.0 72.8 9.9 28.9 25.9 17.9 17.5<br />
1994 13,790,997 4,639,089 9,151,908 66.4 72.8 9.8 28.3 26.2 17.9 17.8<br />
Note appears at end of table<br />
(continued)


