

Social Insurance and Public Assistance
public-assistance-welfare-reform-colonial-times-to-the-present-ziliak ...
public-assistance-welfare-reform-colonial-times-to-the-present-ziliak ...

You also want an ePaper? Increase the reach of your titles
YUMPU automatically turns print PDFs into web optimized ePapers that Google loves.
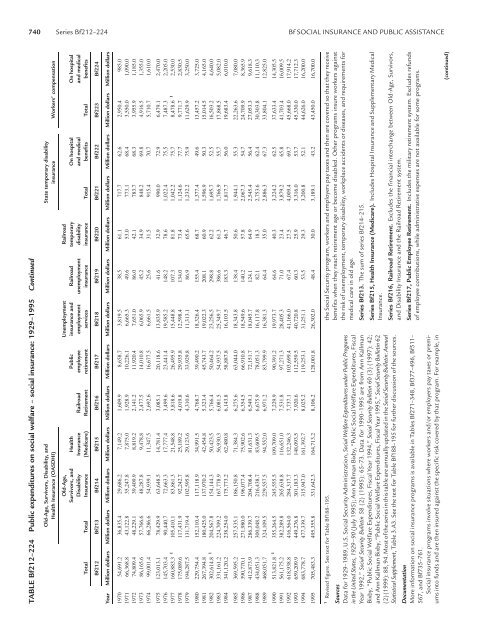
740 Series Bf212–224 Bf SOCIAL INSURANCE AND PUBLIC ASSISTANCE<br />
TABLE Bf212–224 <strong>Public</strong> expenditures on social welfare – social insurance: 1929–1995 Continued<br />
Old-Age, Survivors, Disability, <strong>and</strong> State temporary disability<br />
Health <strong>Insurance</strong> (OASDHI) insurance Workers’ compensation<br />
Old-Age, Unemployment Railroad<br />
Survivors, <strong>and</strong> Health <strong>Public</strong> insurance <strong>and</strong> Railroad temporary On hospital On hospital<br />
Disability <strong>Insurance</strong> Railroad employee employment unemployment disability <strong>and</strong> medical <strong>and</strong> medical<br />
Total Total <strong>Insurance</strong> (Medicare) Retirement retirement services insurance insurance Total benefits Total benefits<br />
Bf212 Bf213 Bf214 Bf215 Bf216 Bf217 Bf218 Bf219 Bf220 Bf221 Bf222 Bf223 Bf224<br />
Year Million dollars Million dollars Million dollars Million dollars Million dollars Million dollars Million dollars Million dollars Million dollars Million dollars Million dollars Million dollars Million dollars<br />
1970 54,691.2 36,835.4 29,686.2 7,149.2 1,609.9 8,658.7 3,819.5 38.5 61.1 717.7 62.6 2,950.4 985.0<br />
1971 66,368.8 43,122.8 35,247.8 7,875.0 1,928.9 10,226.1 6,665.3 49.6 53.0 773.1 68.4 3,550.0 1,090.0<br />
1972 74,809.4 48,229.1 39,409.9 8,819.2 2,141.2 11,920.4 7,651.0 86.0 42.1 783.7 68.3 3,955.9 1,185.0<br />
1973 86,165.6 57,766.6 48,287.8 9,478.8 2,477.5 14,010.8 6,065.9 45.2 34.9 848.2 69.8 4,916.5 1,355.0<br />
1974 99,001.4 66,286.6 54,939.1 11,347.5 2,692.6 16,677.5 6,661.5 25.6 31.5 915.4 70.7 5,710.7 1,610.0<br />
1975 123,013.1 78,429.9 63,648.5 14,781.4 3,085.1 20,118.6 13,835.9 41.6 32.9 990.0 72.9 6,479.1 2,470.0<br />
1976 145,703.4 90,440.7 72,663.3 17,777.4 3,499.6 23,441.4 19,585.2 148.2 78.6 1,022.4 75.5 7,487.3 2,205.0<br />
1977 160,883.3 1 105,410.1 83,861.3 21,548.8 3,818.6 26,495.9 15,448.8 107.3 81.8 1,042.2 75.7 8,478.6 1 2,530.0<br />
1978 175,089.6 117,431.9 92,242.7 25,189.2 4,019.8 29,935.8 12,598.4 134.0 73.4 1,124.6 77.7 9,771.7 2,830.5<br />
1979 194,287.5 131,719.4 102,595.8 29,123.6 4,310.6 33,929.8 11,313.1 86.9 65.6 1,232.2 75.9 11,629.9 3,250.0<br />
1980 229,754.4 152,110.4 117,118.9 34,991.5 4,768.7 39,490.2 18,326.4 155.4 68.7 1,377.4 49.6 13,457.2 3,725.0<br />
1981 267,394.8 180,425.0 137,970.2 42,454.8 5,323.4 45,743.7 19,022.3 208.1 60.9 1,596.9 50.3 15,014.5 4,165.0<br />
1982 302,614.8 1 204,567.8 154,144.3 50,423.5 5,766.4 50,464.2 23,256.5 298.8 62.2 1,695.7 52.5 16,503.2 4,640.0<br />
1983 331,161.2 224,709.2 167,778.9 56,930.3 6,081.5 54,937.5 25,349.7 386.6 61.3 1,766.9 55.7 17,868.5 5,082.0<br />
1984 341,120.2 238,254.0 175,773.2 62,480.8 6,143.8 58,887.8 16,103.5 183.3 46.7 1,817.7 56.0 19,683.4 6,010.0<br />
1985 369,595.2 257,535.1 186,150.8 71,384.3 6,275.6 63,044.0 18,343.8 138.4 50.6 1,944.1 55.3 22,263.6 7,080.0<br />
1986 390,770.1 271,980.0 196,077.4 75,902.6 6,354.5 66,910.8 18,549.6 140.2 57.8 2,067.3 54.7 24,709.9 8,365.9<br />
1987 412,873.9 286,339.7 204,708.4 81,631.3 6,549.1 72,151.7 18,045.7 124.1 64.9 2,545.4 56.4 27,053.3 9,618.3<br />
1988 434,051.3 300,048.2 216,438.7 83,609.5 6,675.9 78,051.3 16,117.8 82.1 18.3 2,753.6 62.4 30,303.8 11,110.3<br />
1989 468,051.7 324,109.5 229,557.5 94,552.0 6,971.2 83,799.9 16,381.3 64.4 35.0 2,886.3 67.3 33,804.1 12,825.0<br />
1990 513,821.8 1 355,264.5 245,555.5 109,709.0 7,229.9 90,391.2 19,973.7 64.6 40.3 3,224.2 62.5 37,633.4 14,305.5<br />
1991 561,175.2 382,289.8 265,638.8 116,651.0 7,531.8 97,271.3 28,405.3 71.0 23.4 3,879.2 65.8 41,703.4 16,009.5<br />
1992 618,938.8 416,564.0 284,317.7 132,246.3 7,737.1 103,699.4 41,166.0 67.4 27.5 4,009.4 69.7 45,668.0 17,914.2<br />
1993 659,209.9 449,276.8 301,183.3 148,093.5 7,920.6 112,559.5 40,720.8 60.3 25.9 3,316.0 53.7 45,330.0 17,712.3<br />
1994 683,778.7 477,339.7 315,947.0 161,392.7 8,025.2 119,253.1 31,251.1 53.5 29.3 3,200.8 52.1 44,626.0 16,200.0<br />
1995 705,483.3 495,355.8 331,642.3 164,713.2 8,106.2 128,001.8 26,302.0 48.4 30.0 3,189.1 43.2 43,450.0 16,700.0<br />
1 Revised figure. See text for Table Bf188–195.<br />
Sources<br />
Data for 1929–1989, U.S. <strong>Social</strong> Security Administration, <strong>Social</strong> Welfare Expenditures under <strong>Public</strong> Programs<br />
in the United States, 1929–90 (July 1995); Ann Kallman Bixby, “<strong>Public</strong> <strong>Social</strong> Welfare Expenditures, Fiscal<br />
Year 1992,” <strong>Social</strong> Security Bulletin 58 (2) (1995): 65–73. Data for 1990–1995 are from Ann Kallman<br />
Bixby, “<strong>Public</strong> <strong>Social</strong> Welfare Expenditures, Fiscal Year 1994,” <strong>Social</strong> Security Bulletin 60 (3) (1997): 42;<br />
<strong>and</strong> Ann Kallman Bixby, “<strong>Public</strong> <strong>Social</strong> Welfare Expenditures, Fiscal Year 1995,” <strong>Social</strong> Security Bulletin 62<br />
(2) (1999): 88, 94. Most of the series in this table are annually updated in the <strong>Social</strong> Security Bulletin: Annual<br />
Statistical Supplement,Table 3.A3. See the text for Table Bf188–195 for further discussion of the sources.<br />
Documentation<br />
More information on social insurance programs is available in Tables Bf271–348, Bf377–496, Bf511–<br />
567, <strong>and</strong> Bf735–761.<br />
<strong>Social</strong> insurance programs involve situations where workers <strong>and</strong>/or employers pay taxes or premiums<br />
into funds <strong>and</strong> are then insured against the specific risk covered by that program. For example, in<br />
the <strong>Social</strong> Security program, workers <strong>and</strong> employers pay taxes <strong>and</strong> then are covered so that they receive<br />
benefits when they reach retirement age or become disabled. Other programs insure workers against<br />
the risk of unemployment, temporary disability, workplace accidents or diseases, <strong>and</strong> requirements for<br />
medical care in old age.<br />
Series Bf213. The sum of series Bf214–215.<br />
Series Bf215, Health <strong>Insurance</strong> (Medicare). Includes Hospital <strong>Insurance</strong> <strong>and</strong> Supplementary Medical<br />
<strong>Insurance</strong>.<br />
Series Bf216, Railroad Retirement. Excludes the financial interchange between Old-Age, Survivors,<br />
<strong>and</strong> Disability <strong>Insurance</strong> <strong>and</strong> the Railroad Retirement system.<br />
Series Bf217, <strong>Public</strong> Employee Retirement. Includes the military retirement system. Excludes refunds<br />
of employee contributions, while administrative expenses are not available for some programs.<br />
(continued)


