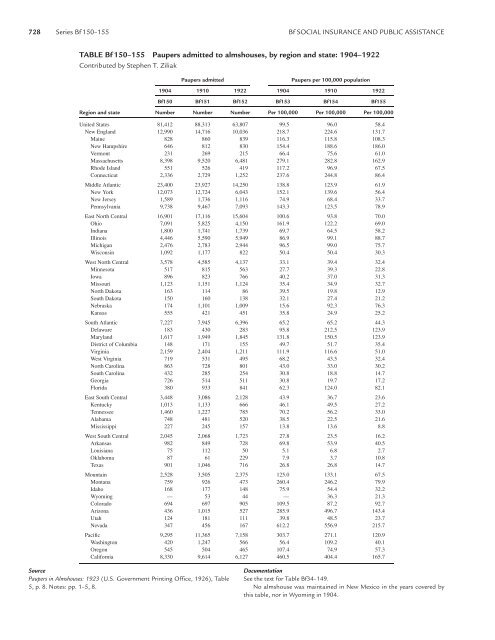
728 Series Bf 150–155 Bf SOCIAL INSURANCE AND PUBLIC ASSISTANCE TABLE Bf 150–155 Paupers admitted to almshouses, by region <strong>and</strong> state: 1904–1922 Contributed by Stephen T. Ziliak Paupers admitted Paupers per 100,000 population 1904 1910 1922 1904 1910 1922 Bf150 Bf151 Bf152 Bf153 Bf154 Bf155 Region <strong>and</strong> state Number Number Number Per 100,000 Per 100,000 Per 100,000 United States 81,412 88,313 63,807 99.5 96.0 58.4 New Engl<strong>and</strong> 12,990 14,716 10,036 218.7 224.6 131.7 Maine 828 860 839 116.3 115.8 108.3 New Hampshire 646 812 830 154.4 188.6 186.0 Vermont 231 269 215 66.4 75.6 61.0 Massachusetts 8,398 9,520 6,481 279.1 282.8 162.9 Rhode Isl<strong>and</strong> 551 526 419 117.2 96.9 67.5 Connecticut 2,336 2,729 1,252 237.6 244.8 86.4 Middle Atlantic 23,400 23,927 14,250 138.8 123.9 61.9 New York 12,073 12,724 6,043 152.1 139.6 56.4 New Jersey 1,589 1,736 1,116 74.9 68.4 33.7 Pennsylvania 9,738 9,467 7,093 143.3 123.5 78.9 East North Central 16,901 17,116 15,604 100.6 93.8 70.0 Ohio 7,091 5,825 4,150 161.9 122.2 69.0 Indiana 1,800 1,741 1,739 69.7 64.5 58.2 Illinois 4,446 5,590 5,949 86.9 99.1 88.7 Michigan 2,476 2,783 2,944 96.5 99.0 75.7 Wisconsin 1,092 1,177 822 50.4 50.4 30.3 West North Central 3,578 4,585 4,137 33.1 39.4 32.4 Minnesota 517 815 563 27.7 39.3 22.8 Iowa 896 823 766 40.2 37.0 31.3 Missouri 1,123 1,151 1,124 35.4 34.9 32.7 North Dakota 163 114 86 39.5 19.8 12.9 South Dakota 150 160 138 32.1 27.4 21.2 Nebraska 174 1,101 1,009 15.6 92.3 76.3 Kansas 555 421 451 35.8 24.9 25.2 South Atlantic 7,227 7,945 6,396 65.2 65.2 44.3 Delaware 183 430 283 95.8 212.5 123.9 Maryl<strong>and</strong> 1,617 1,949 1,845 131.8 150.5 123.9 District of Columbia 148 171 155 49.7 51.7 35.4 Virginia 2,159 2,404 1,211 111.9 116.6 51.0 West Virginia 719 531 495 68.2 43.5 32.4 North Carolina 863 728 801 43.0 33.0 30.2 South Carolina 432 285 254 30.8 18.8 14.7 Georgia 726 514 511 30.8 19.7 17.2 Florida 380 933 841 62.3 124.0 82.1 East South Central 3,448 3,086 2,128 43.9 36.7 23.6 Kentucky 1,013 1,133 666 46.1 49.5 27.2 Tennessee 1,460 1,227 785 70.2 56.2 33.0 Alabama 748 481 520 38.5 22.5 21.6 Mississippi 227 245 157 13.8 13.6 8.8 West South Central 2,045 2,068 1,723 27.8 23.5 16.2 Arkansas 982 849 728 69.8 53.9 40.5 Louisiana 75 112 50 5.1 6.8 2.7 Oklahoma 87 61 229 7.9 3.7 10.8 Texas 901 1,046 716 26.8 26.8 14.7 Mountain 2,528 3,505 2,375 125.0 133.1 67.5 Montana 759 926 473 260.4 246.2 79.9 Idaho 168 177 148 75.9 54.4 32.2 Wyoming — 53 44 — 36.3 21.3 Colorado 694 697 905 109.5 87.2 92.7 Arizona 436 1,015 527 285.9 496.7 143.4 Utah 124 181 111 39.8 48.5 23.7 Nevada 347 456 167 612.2 556.9 215.7 Pacific 9,295 11,365 7,158 303.7 271.1 120.9 Washington 420 1,247 566 56.4 109.2 40.1 Oregon 545 504 465 107.4 74.9 57.3 California 8,330 9,614 6,127 460.5 404.4 165.7 Source Paupers in Almshouses: 1923 (U.S. Government Printing Office, 1926), Table 5, p. 8. Notes: pp. 1–5, 8. Documentation See the text for Table Bf34–149. No almshouse was maintained in New Mexico in the years covered by this table, nor in Wyoming in 1904.
POOR RELIEF Series Bf 156–175 729 TABLE Bf 156–175 Local public poor relief expenditures <strong>and</strong> the value of pauper labor in New York State <strong>and</strong> New York City, by type of relief: 1840–1895 Contributed by Joan Underhill Hannon New York State Local public expenditures New York City Local public expenditures <strong>Public</strong> relief – Connected with county <strong>and</strong> <strong>Public</strong> relief – Connected with city Value of including or excluding city poorhouses – including including or excluding poorhouse – including pauper labor Value of poorhouse repairs or excluding poorhouse poorhouse repairs or excluding poorhouse in city <strong>and</strong> pauper labor <strong>and</strong> improvements repairs <strong>and</strong> improvements <strong>and</strong> improvements repairs <strong>and</strong> improvements Temporary county Temporary in city Including Excluding outdoor relief Including Excluding poorhouses Including Excluding outdoor relief Including Excluding poorhouse Bf156 Bf157 Bf158 Bf159 Bf160 Bf161 Bf162 Bf163 Bf164 Bf165 Bf166 Bf167 Year Dollars Dollars Dollars Dollars Dollars Dollars Dollars Dollars Dollars Dollars Dollars Dollars 1840 — 493,596 146,315 — 347,281 — — 188,683 28,019 — 160,664 — 1841 — 508,214 150,205 — 358,009 55,211 — 195,997 24,060 — 171,937 27,551 1842 — 485,793 163,128 — 322,665 32,611 — 170,188 26,894 — 143,294 2,979 1843 — 558,741 240,205 — 318,536 58,895 — 192,908 55,748 — 137,160 26,983 1844 — 537,932 214,268 — 323,664 37,754 — 205,143 50,859 — 154,284 6,000 1846 — 538,133 225,131 — 313,002 — — 205,604 65,134 — 140,470 — 1847 — 674,843 257,662 — 417,181 — — 312,113 96,019 — 216,094 — 1848 — — — — — — — — — — — — 1849 — 797,985 331,328 — 466,657 — — 308,508 91,074 — 217,434 — 1850 — 691,064 295,730 — 395,334 — — 231,986 76,255 — 155,731 — 1851 — 786,755 340,358 — 446,397 — — 264,329 71,904 — 192,425 — 1852 — 939,731 409,814 — 529,917 — — 304,465 91,189 — 213,276 — 1853 — 930,974 345,765 — 585,209 — — 296,286 82,136 — 214,150 — 1854 — 1,057,923 380,100 — 677,823 — — 346,828 83,705 — 263,123 — 1855 — 1,316,048 504,484 — 811,564 — — 444,925 121,861 — 323,064 — 1856 — 1,315,805 455,812 — 859,993 — — 442,509 95,522 — 346,987 — 1857 — 1,218,034 443,383 — 774,651 — — 428,457 108,756 — 319,701 — 1858 — 1,425,269 625,002 — 800,267 — — 490,883 139,731 — 351,152 — 1859 — 1,297,699 586,511 — 711,188 — — 436,434 111,702 — 324,732 — 1860 — 1,286,701 524,551 — 762,150 — — 474,529 88,833 — 385,696 — 1861 — 1,284,032 485,189 — 798,843 — — 463,930 69,162 — 394,768 — 1862 — 1,187,152 475,687 — 711,465 — — 404,431 94,718 — 309,713 — 1863 — 1,382,044 551,711 — 830,333 — — 439,056 83,751 — 355,305 — 1864 — 1,803,757 682,086 — 1,121,671 — — 497,556 99,630 — 397,926 — 1865 — 2,252,606 761,087 — 1,491,519 — — 741,568 104,803 — 636,765 — 1866 — 2,205,268 740,727 — 1,464,541 — — 701,279 90,529 — 610,750 — 1867 — 2,306,709 759,840 — 1,546,869 — — 669,555 70,441 — 599,114 — 1868 — 2,472,286 888,874 — 1,583,412 — — 777,479 135,858 — 641,621 — 1869 — 2,326,951 866,583 — 1,460,368 — — 717,219 128,385 — 588,834 — 1870 2,625,349 2,415,785 916,809 1,708,540 1,498,976 — 814,463 740,551 126,360 688,103 614,191 — 1871 2,337,853 2,180,068 716,487 1,621,366 1,463,581 — 814,719 752,104 123,732 690,987 628,372 — 1872 2,266,649 2,163,015 747,159 1,519,490 1,415,856 — 823,021 772,735 104,051 718,970 668,684 — 1873 2,580,806 2,503,373 841,958 1,738,848 1,661,415 — 877,649 828,689 104,165 773,484 724,524 — 1874 2,648,146 2,525,039 1,021,946 1,626,200 1,503,093 — 790,103 777,283 102,102 688,001 675,181 — 1875 2,643,908 2,502,904 944,671 1,699,237 1,558,233 — 833,363 756,396 95,521 737,842 660,875 — 1876 2,563,607 2,499,267 931,877 1,631,730 1,567,390 — 786,877 759,253 74,395 712,482 684,858 — 1877 2,737,795 2,643,362 1,095,231 1,642,564 1,548,131 — 799,425 771,545 83,248 716,177 688,297 — 1878 2,519,429 2,414,610 938,450 1,580,979 1,476,160 — 755,705 732,515 59,430 696,275 673,085 — 1879 2,403,342 2,312,033 788,766 1,614,576 1,523,267 — 827,537 801,775 59,909 767,628 741,866 — 1880 2,301,816 1,958,742 743,258 1,558,558 1,215,484 — 854,305 841,993 58,701 795,604 783,292 — 1881 — — — — — — — — — — — — 1882 — — — — — — — — — — — — 1883 2,659,290 2,538,165 636,917 2,022,373 1,901,248 — 1,070,320 1,010,270 57,488 1,012,832 952,782 — 1884 2,568,653 2,460,920 651,305 1,917,348 1,809,615 — 949,304 910,364 38,995 910,309 871,369 — 1885 2,644,120 2,543,007 732,514 1,911,606 1,810,493 — 930,833 894,038 63,100 867,733 830,938 — 1886 2,946,429 2,832,239 811,687 2,134,742 2,020,552 — 1,175,382 1,118,882 74,699 1,100,683 1,044,183 — 1887 2,909,244 2,849,956 734,071 2,175,173 2,115,885 — 1,164,713 1,164,713 69,365 1,095,348 1,095,348 — 1888 3,797,968 3,731,889 756,010 3,041,958 2,975,879 — 1,898,611 1,898,611 62,030 1,836,581 1,836,581 — 1889 3,801,615 3,432,340 742,389 3,059,226 2,689,951 — 1,802,663 1,502,432 61,975 1,740,688 1,440,457 — 1890 3,036,717 2,898,174 710,886 2,325,831 2,187,288 — 1,635,127 1,537,027 40,000 1,595,127 1,497,027 — 1891 3,627,996 3,368,216 710,476 2,917,520 2,657,740 — 1,571,390 1,396,663 39,940 1,531,450 1,356,723 — 1892 3,147,063 3,045,502 663,369 2,483,694 2,382,133 — 1,121,724 1,094,474 40,000 1,081,724 1,054,474 — 1893 3,857,476 3,657,874 671,698 3,185,778 2,986,176 — 1,790,188 1,760,488 40,000 1,750,188 1,720,488 — 1894 3,939,240 3,784,940 758,488 3,180,752 3,026,452 — 1,828,102 1,805,957 82,500 1,745,602 1,723,457 — 1895 3,839,829 3,739,783 743,654 3,096,175 2,996,129 — 1,814,875 1,794,675 60,000 1,754,875 1,734,675 — (continued)