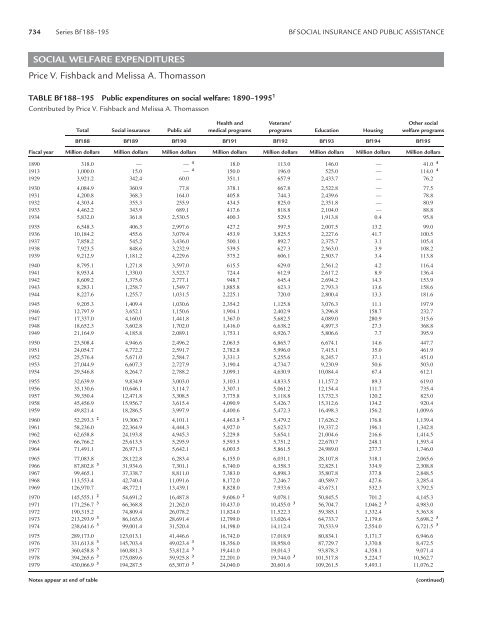
734 Series Bf 188–195 Bf SOCIAL INSURANCE AND PUBLIC ASSISTANCE SOCIAL WELFARE EXPENDITURES Price V. Fishback <strong>and</strong> Melissa A. Thomasson TABLE Bf 188–195 <strong>Public</strong> expenditures on social welfare: 1890–1995 1 Contributed by Price V. Fishback <strong>and</strong> Melissa A. Thomasson Health <strong>and</strong> Veterans’ Other social Total <strong>Social</strong> insurance <strong>Public</strong> aid medical programs programs Education Housing welfare programs Bf188 Bf189 Bf190 Bf191 Bf192 Bf193 Bf194 Bf195 Fiscal year Million dollars Million dollars Million dollars Million dollars Million dollars Million dollars Million dollars Million dollars 1890 318.0 — — 4 18.0 113.0 146.0 — 41.0 4 1913 1,000.0 15.0 — 4 150.0 196.0 525.0 — 114.0 4 1929 3,921.2 342.4 60.0 351.1 657.9 2,433.7 — 76.2 1930 4,084.9 360.9 77.8 378.1 667.8 2,522.8 — 77.5 1931 4,200.8 368.3 164.0 405.8 744.3 2,439.6 — 78.8 1932 4,303.4 355.3 255.9 434.5 825.0 2,351.8 — 80.9 1933 4,462.2 343.9 689.1 417.6 818.8 2,104.0 — 88.8 1934 5,832.0 361.8 2,530.5 400.3 529.5 1,913.8 0.4 95.8 1935 6,548.3 406.3 2,997.6 427.2 597.5 2,007.5 13.2 99.0 1936 10,184.2 455.6 3,079.4 453.9 3,825.5 2,227.6 41.7 100.5 1937 7,858.2 545.2 3,436.0 500.1 892.7 2,375.7 3.1 105.4 1938 7,923.5 848.6 3,232.9 539.5 627.3 2,563.0 3.9 108.2 1939 9,212.9 1,181.2 4,229.6 575.2 606.1 2,503.7 3.4 113.8 1940 8,795.1 1,271.8 3,597.0 615.5 629.0 2,561.2 4.2 116.4 1941 8,953.4 1,330.0 3,523.7 724.4 612.9 2,617.2 8.9 136.4 1942 8,609.2 1,375.6 2,777.1 948.7 645.4 2,694.2 14.3 153.9 1943 8,283.1 1,258.7 1,549.7 1,885.8 623.3 2,793.3 13.6 158.6 1944 8,227.6 1,255.7 1,031.5 2,225.1 720.0 2,800.4 13.3 181.6 1945 9,205.3 1,409.4 1,030.6 2,354.2 1,125.8 3,076.3 11.1 197.9 1946 12,797.9 3,652.1 1,150.6 1,904.1 2,402.9 3,296.8 158.7 232.7 1947 17,337.0 4,160.0 1,441.8 1,367.0 5,682.5 4,089.0 280.9 315.6 1948 18,652.3 3,602.8 1,702.0 1,416.0 6,638.2 4,897.3 27.3 368.8 1949 21,164.9 4,185.8 2,089.1 1,753.1 6,926.7 5,806.6 7.7 395.9 1950 23,508.4 4,946.6 2,496.2 2,063.5 6,865.7 6,674.1 14.6 447.7 1951 24,054.7 4,772.2 2,591.7 2,782.8 5,996.0 7,415.1 35.0 461.9 1952 25,576.4 5,671.0 2,584.7 3,331.3 5,255.6 8,245.7 37.1 451.0 1953 27,044.9 6,607.3 2,727.9 3,190.4 4,734.7 9,230.9 50.6 503.0 1954 29,546.8 8,264.7 2,788.2 3,099.1 4,630.9 10,084.4 67.4 612.1 1955 32,639.9 9,834.9 3,003.0 3,103.1 4,833.5 11,157.2 89.3 619.0 1956 35,130.6 10,646.1 3,114.7 3,307.1 5,061.2 12,154.4 111.7 735.4 1957 39,350.4 12,471.8 3,308.5 3,775.8 5,118.8 13,732.3 120.2 823.0 1958 45,456.9 15,956.7 3,615.4 4,090.9 5,426.7 15,312.6 134.2 920.4 1959 49,821.4 18,286.5 3,997.9 4,400.6 5,472.3 16,498.3 156.2 1,009.6 1960 52,293.3 2 19,306.7 4,101.1 4,463.8 2 5,479.2 17,626.2 176.8 1,139.4 1961 58,236.0 22,364.9 4,444.3 4,927.0 5,623.7 19,337.2 196.1 1,342.8 1962 62,658.8 24,193.8 4,945.3 5,229.8 5,654.1 21,004.6 216.6 1,414.5 1963 66,766.2 25,613.5 5,295.9 5,593.5 5,751.2 22,670.7 248.1 1,593.4 1964 71,491.1 26,971.3 5,642.1 6,003.5 5,861.5 24,989.0 277.7 1,746.0 1965 77,083.8 28,122.8 6,283.4 6,155.0 6,031.1 28,107.8 318.1 2,065.6 1966 87,802.8 3 31,934.6 7,301.1 6,740.0 6,358.3 32,825.1 334.9 2,308.8 1967 99,465.1 37,338.7 8,811.0 7,383.0 6,898.3 35,807.8 377.8 2,848.5 1968 113,553.4 42,740.4 11,091.6 8,172.0 7,246.7 40,589.7 427.6 3,285.4 1969 126,970.7 48,772.1 13,439.1 8,828.0 7,933.6 43,673.1 532.3 3,792.5 1970 145,555.1 2 54,691.2 16,487.8 9,606.0 2 9,078.1 50,845.5 701.2 4,145.3 1971 171,256.7 3 66,368.8 21,262.0 10,437.0 10,455.0 3 56,704.7 1,046.2 3 4,983.0 1972 190,315.2 74,809.4 26,078.2 11,824.0 11,522.3 59,385.1 1,332.4 5,363.8 1973 213,293.9 3 86,165.6 28,691.4 12,799.0 13,026.4 64,733.7 2,179.6 5,698.2 3 1974 238,641.6 3 99,001.4 31,520.4 14,198.0 14,112.4 70,533.9 2,554.0 6,721.5 3 1975 289,173.0 123,013.1 41,446.6 16,742.0 17,018.9 80,834.1 3,171.7 6,946.6 1976 331,613.8 3 145,703.4 49,023.4 3 18,356.0 18,958.0 87,729.7 3,370.8 8,472.5 1977 360,458.8 3 160,881.3 53,812.4 3 19,441.0 19,014.3 93,878.3 4,358.1 9,071.4 1978 394,265.6 3 175,089.6 59,925.8 3 22,201.0 19,744.0 3 101,517.8 5,224.7 10,562.7 1979 430,066.9 3 194,287.5 65,307.0 3 24,040.0 20,601.6 109,261.5 5,493.1 11,076.2 Notes appear at end of table (continued)
SOCIAL WELFARE EXPENDITURES Series Bf 188–195 735 TABLE Bf 188–195 <strong>Public</strong> expenditures on social welfare: 1890–1995 Continued Health <strong>and</strong> Veterans’ Other social Total <strong>Social</strong> insurance <strong>Public</strong> aid medical programs programs Education Housing welfare programs Bf188 Bf189 Bf190 Bf191 Bf192 Bf193 Bf194 Bf195 Fiscal year Million dollars Million dollars Million dollars Million dollars Million dollars Million dollars Million dollars Million dollars 1980 492,713.7 2 229,754.4 72,703.1 27,263.0 2 21,465.5 121,049.6 6,879.0 13,599.1 1981 552,882.8 3 267,394.8 83,634.0 29,588.0 23,440.9 3 130,108.5 6,733.5 3 11,983.1 1982 601,344.9 3 302,614.8 82,206.2 3 32,870.0 24,708.1 138,089.3 9,202.1 11,654.4 1983 649,229.1 331,161.2 88,330.7 34,090.0 25,801.9 146,415.4 10,963.5 12,466.4 1984 678,112.1 341,120.2 92,979.4 35,722.0 26,274.9 157,188.9 11,531.8 13,294.9 1985 732,249.5 3, 2 369,595.2 98,361.8 39,053.0 2 27,041.7 3 172,047.5 12,598.5 13,551.8 1986 781,725.2 390,770.1 104,200.2 43,953.0 27,444.9 189,234.6 11,961.8 3 14,160.6 1987 834,121.9 412,873.9 112,115.1 48,067.0 28,050.8 204,563.7 13,173.5 15,277.9 1988 887,951.2 3 434,051.3 119,723.4 53,096.0 29,663.4 3 219,382.2 16,555.9 15,479.0 1989 957,394.6 3 468,051.7 3 128,609.8 57,123.0 30,103.7 3 238,771.0 18,126.7 16,608.7 1990 1,048,950.8 513,821.8 146,811.1 61,684.0 30,916.2 258,331.6 19,468.5 17,917.6 1991 1,159,626.4 561,175.2 181,334.4 65,810.0 32,857.3 277,147.1 21,522.6 19,779.8 1992 1,266,867.1 618,938.8 207,953.0 70,114.0 35,642.0 292,070.6 20,617.2 21,531.5 1993 1,366,754.1 3 659,209.9 220,999.8 74,717.0 3 36,378.3 331,996.8 20,782.3 22,670.0 1994 1,435,819.3 3 683,778.7 238,025.3 80,235.0 3 37,894.8 344,091.0 27,032.0 24,762.5 1995 1,505,136.4 705,483.3 253,530.0 85,507.0 39,072.0 365,625.3 29,361.1 26,557.7 1 See text on inclusion of Alaska, Hawai’i, <strong>and</strong> outlying areas. 2 The data reported in the 1997 <strong>and</strong> 1999 source articles do not precisely match the data in the July 1995 source, owing to revisions in the procedures for estimating health expenditures. The differences for them are typically less than $500 million. 3 Revised figure. See text. 4 <strong>Public</strong> aid included with other social welfare services. Sources Estimates presented for 1890 <strong>and</strong> 1913 were based primarily on the following: R. A. Musgrave <strong>and</strong> J. J. Culbertson, “The Growth of <strong>Public</strong> Expenditures in the U.S., 1890–1948,” National Tax Journal (June 1953): 97–115; J. Frederic Dewhurst <strong>and</strong> Associates, America’s Needs <strong>and</strong> Resources (Twentieth Century Fund, 1955); <strong>and</strong> reports of official agencies. Data for 1929–1989, U.S. <strong>Social</strong> Security Administration, <strong>Social</strong> Welfare Expenditures under <strong>Public</strong> Programs in the United States, 1929–90 (July 1995); Ann Kallman Bixby, “<strong>Public</strong> <strong>Social</strong> Welfare Expenditures, Fiscal Year 1992,” <strong>Social</strong> Security Bulletin 58 (2) (1995): 65–73. Data for 1990–1995 are from Ann Kallman Bixby, “<strong>Public</strong> <strong>Social</strong> Welfare Expenditures, Fiscal Year 1994,” <strong>Social</strong> Security Bulletin 60 (3) (1997): 42; <strong>and</strong> Ann Kallman Bixby, “<strong>Public</strong> <strong>Social</strong> Welfare Expenditures, Fiscal Year 1995,” <strong>Social</strong> Security Bulletin 62 (2) (1999): 88. The information is updated annually in the <strong>Social</strong> Security Bulletin <strong>and</strong> the <strong>Social</strong> Security Bulletin: Annual Statistical Supplement, Table 3.A3. Documentation The material for the period 1929–1964 was first reported in Ida C. Merriam <strong>and</strong> Alfred M. Skolnik, <strong>Social</strong> Welfare Expenditures under <strong>Public</strong> Programs in the United States, 1929–1966, Research Report number 25 (U.S. <strong>Social</strong> Security Administration, 1968). This report included a compendium of detailed data covering each year from 1929 to 1966, <strong>and</strong> a complete description of the methodology used in formulating the series. In situations where the published information for a year differs in the sources, the number published later was used with one exception: there was a misprint for the 1991 data in the 1996 Annual Statistical Supplement, <strong>and</strong> so the data for 1991 are from Summer 1995 <strong>Social</strong> Security Bulletin. Information on the state <strong>and</strong> local breakdown for all of the programs in Tables Bf212–270 from 1929 through 1989 is available in U.S. <strong>Social</strong> Security Administration (July 1995); Merriam <strong>and</strong> Skolnik (1968); <strong>and</strong> the annual articles in the <strong>Social</strong> Security Bulletin. For example, see Ann Kallman Bixby, “<strong>Public</strong> <strong>Social</strong> Welfare Expenditures, Fiscal Year 1994,” <strong>Social</strong> Security Bulletin 60 (3) (1997): 43–4; <strong>and</strong> Ann Kallman Bixby, “<strong>Public</strong> <strong>Social</strong> Welfare Expenditures, Fiscal Year 1995,” <strong>Social</strong> Security Bulletin 62 (2) (1999): 89, 90. Scattered data relating to social welfare programs in particular localities or states may be found in other sources. The definitions used in these sources, however, are highly variable <strong>and</strong> the original source of the data is frequently not indicated. No data comparable to those shown for 1929–1993 are readily available. <strong>Social</strong> welfare expenditures include the areas of income maintenance, health, education, housing, veterans’ benefits, <strong>and</strong> other welfare services directed specifically toward promoting the economic <strong>and</strong> social welfare of individuals <strong>and</strong> families. The social welfare expenditures data collected by the U.S. <strong>Social</strong> Security Administration fit the definitions of social welfare spending used by the Organization for Economic Co-operation <strong>and</strong> Development <strong>and</strong> the International Labour Office. Expenditures are grouped on the basis of statutory programs <strong>and</strong> administrative structure rather than strictly by function. Finally, the economic status of the individual or family receiving benefits is not a criterion for inclusion in the series. Rather, the requirement is that the funds be expended through the government apparatus in compliance with or as a result of public law. For further information about the components of these series, see the text for Tables Bf212–270. <strong>Social</strong> welfare expenditures under public programs represent payments from federal, state, <strong>and</strong> local revenues (general <strong>and</strong> special) <strong>and</strong> trust funds. They include capital outlays as well as administrative expenses unless otherwise noted. Some payments abroad are included. Programs or services financed by loans are excluded. The expenditures are reported on a fiscal year basis. Through 1976, the fiscal year ended June 30 for the federal government, most states, <strong>and</strong> some localities. Beginning in 1977, federal fiscal years end on September 30. Data on federal programs include expenditures in Alaska <strong>and</strong> Hawai’i for all years; state <strong>and</strong> local data include expenditures in Alaska <strong>and</strong> Hawai’i from the year of their admission to the Union. Data include federal expenditures (<strong>and</strong> matching local expenditures under grant programs) in Puerto Rico, the Virgin Isl<strong>and</strong>s, Guam, Trust Territory of the Pacific, American Samoa, <strong>and</strong> the Panama Canal Zone, as well as expenditures to beneficiaries of some of the income-maintenance programs residing in foreign countries, <strong>and</strong> that part of Defense Department education <strong>and</strong> health expenses incurred abroad. Wherever possible, data for federal, federal–state, <strong>and</strong> federal–local programs were drawn from published <strong>and</strong> unpublished materials of the appropriate federal agencies <strong>and</strong> from the annual Budget of the United States Government. The principal source for state, state–local, <strong>and</strong> local program statistics has been the census of governments. To bridge gaps, especially for early years of the series, <strong>and</strong> to augment fragmentary data, the U.S. <strong>Social</strong> Security Administration has estimated expenditures for certain years for some programs (e.g., state <strong>and</strong> local public employee retirement benefits <strong>and</strong> administration). The series are often revised in response to new data, new benchmarks, <strong>and</strong> changes in reporting from other sources. The U.S. <strong>Social</strong> Security Administration often publishes the revised versions of the recent data but in many cases offers revised information for earlier years for years ending in 0 <strong>and</strong> 5. Discussions with the people at the U.S. <strong>Social</strong> Security Administration who compile the statistics suggest that a search for “the” number in any single year would be futile. The numbers are basically estimates from surveys, reports of other agencies, <strong>and</strong> other sources, <strong>and</strong> they (continued)