782 Series Bf484–496 Bf SOCIAL INSURANCE AND PUBLIC ASSISTANCE TABLE Bf484–496 Unemployment <strong>Insurance</strong> – coverage, benefits, <strong>and</strong> financing: 1938–1997 Continued Average Average Average Taxable Average weekly benefit actual actual wages paid in monthly Average Average Average as percentage duration Claimants duration of Total covered Net reserves, covered weekly insured First weekly initial weekly benefit of average of benefit exhausting benefits for Total benefits contributions employment balance as of employment unemployment payments claims amount weekly wage payments benefits exhaustees paid collected during year end of year Bf484 Bf485 Bf486 Bf487 Bf488 Bf489 Bf490 Bf491 Bf492 Bf493 Bf494 Bf495 Bf496 Thous<strong>and</strong> Thous<strong>and</strong> Thous<strong>and</strong> Thous<strong>and</strong> Year Number Number Number Number Dollars Percent Weeks Number Weeks dollars dollars dollars dollars 1980 71,258,455 3,355,747 9,992,123 479,769 99.66 36.6 14.9 3,071,943 22.7 13,768,135 11,414,649 458,643,511 6,591,827 1981 71,965,970 3,044,857 9,407,372 450,846 106.61 35.9 14.4 2,989,177 23.0 13,221,592 11,624,545 478,414,824 5,745,115 1982 70,331,861 4,058,646 11,648,448 579,252 119.34 37.7 15.9 4,174,709 23.2 20,649,840 12,206,070 477,471,932 2,644,584 1983 70,817,863 3,394,666 8,907,190 441,653 123.59 37.2 17.5 4,179,622 23.4 17,755,392 14,548,669 532,288,687 5,803,331 1984 75,204,621 2,474,809 7,742,547 371,773 123.47 35.5 14.4 2,606,145 22.8 12,598,229 18,757,690 586,020,262 2,204,797 1985 77,467,012 2,616,958 8,372,070 390,294 128.14 35.3 14.2 2,572,059 22.7 14,124,342 19,296,983 611,969,897 10,069,416 1986 79,093,152 2,642,644 8,360,752 376,227 135.65 35.8 14.5 2,687,723 22.9 15,402,735 18,111,266 638,038,517 15,402,260 1987 81,352,396 2,300,399 7,203,357 326,153 140.55 35.5 14.6 2,408,471 22.7 13,617,007 17,576,976 667,498,815 23,174,690 1988 83,984,776 2,080,582 6,860,662 312,882 144.97 34.9 13.7 1,979,285 22.7 12,579,703 17,720,628 705,002,395 31,103,671 1989 86,164,595 2,157,666 7,368,766 328,819 151.73 35.4 13.2 1,940,390 22.9 13,641,569 16,451,876 738,265,107 36,870,882 1990 87,008,189 2,521,564 8,628,557 387,001 161.56 36.0 13.4 2,323,255 23.1 17,320,777 15,221,274 759,670,530 37,937,017 1991 84,905,782 3,341,935 10,074,550 447,593 169.88 36.4 15.4 3,472,019 23.2 24,582,501 14,510,670 751,666,268 30,488,785 1992 85,098,137 3,245,191 9,243,338 407,344 173.64 35.4 16.2 3,838,011 23.3 23,956,510 16,972,655 776,502,595 25,846,579 1993 86,850,536 2,751,441 7,884,326 342,309 179.62 36.0 15.9 3,203,897 23.4 20,687,678 19,831,045 807,165,885 28,001,956 1994 89,690,770 2,669,872 7,959,281 342,730 182.16 35.7 15.5 2,977,468 23.2 20,433,832 21,802,069 856,255,509 31,343,551 1995 92,328,088 2,571,951 8,035,229 357,041 187.29 35.5 14.7 2,661,773 23.1 20,122,189 21,970,828 889,901,028 35,403,296 1996 94,685,734 2,595,585 7,989,615 351,361 189.45 34.5 14.9 2,738,963 23.2 20,634,904 21,577,968 923,895,199 38,631,922 1997 97,837,884 2,322,573 7,325,279 321,511 192.76 33.5 14.6 2,484,911 23.0 18,605,353 21,247,040 970,110,253 43,833,157 Sources All series except series Bf487. Unemployment <strong>Insurance</strong> Financial Data H<strong>and</strong>book number 394 from the Information Technology Support Center (ITSC) in Maryl<strong>and</strong>. Series Bf487. Through 1966, data were collected by the Bureau of the Census from monthly issues of the U.S. Manpower Administration’s Unemployment Statistics. Beginning in 1967, data are from evidence posted February 24, 2000, on the U.S. Department of Labor, Employment Training Administration Internet site. Documentation ITSC is a collaboration of state employment security agencies, the Department of Labor (DOL), <strong>and</strong> private sector partners. Most of these data were compiled from monthly <strong>and</strong> quarterly statistical <strong>and</strong> accounting reports submitted by the State Employment Security agencies to the U.S. Employment <strong>and</strong> Training Administration of the U.S. Department of Labor. Revised data <strong>and</strong> corrections have been incorporated into this edition to the extent possible. Data contained in this h<strong>and</strong>book may not be identical with state records. The <strong>Social</strong> Security Act of 1935 established Unemployment <strong>Insurance</strong> (UI) as a federally m<strong>and</strong>ated program run by the states. The states collect payroll taxes from employers to fund the system. After the <strong>Social</strong> Security Act passed, the states had to pass enabling legislation <strong>and</strong> then wait two years to accumulate enough reserves to begin paying benefits. Because Wisconsin had passed an unemployment insurance act prior to 1935, it was the first state to pay benefits. By 1938, roughly 75 percent of payrolls were covered by unemployment insurance. The percentage rose to a peak of 98 percent in 1979 <strong>and</strong> fell back to about 92.4 percent in 1994. To fund the system, employers pay taxes on employee earnings up to a specific maximum per employee in each state. Part of the taxes (0.4 percent of taxable wages in 1970) is remitted to the federal government, which in turn provides grants to the states for the cost of administering unemployment insurance <strong>and</strong> employment services. The payroll contribution rates for individual employers vary to some extent in response to the unemployment experience of workers in the employer’s operation. Reimbursable coverage has been excluded from series Bf484 <strong>and</strong> Bf493–495. However, the claims resulting from reimbursable coverage have not been excluded from series Bf485–486 <strong>and</strong> Bf488–492. In June 1962, employees engaged in the agricultural aspects of the sugar cane industry who were previously covered under a special unemployment insurance law were brought under the Puerto Rico Employment Security Act of 1957. Series Bf484. Average monthly covered employment represents the twelve-month average of the covered employees reported to states by each employer for 1938–1944 for the last payroll period in the month. For 1945–1962, data represent the twelve-month average for the payroll period ending nearest the fifteenth day of the month. After 1963, data represent the twelve-month average for the payroll period including the twelfth day of the month. Covered employment represents employment in industrial <strong>and</strong> commercial establishments of eight or more for the period 1941–1955 <strong>and</strong> four or more for 1956 to 1970. In some states, the covered employment also represents employment in smaller establishments <strong>and</strong> for additional groups of workers, such as state <strong>and</strong> local employees or seamen. Although the federal law requires only employers to pay taxes, some states require some workers to contribute as well. Series Bf484–485. Beginning in 1964, the series on the average number of weekly insured employment, series Bf485, includes workers in the sugar cane industry, while series Bf484 excludes them. Series Bf487. Calculated as an average for the year of the number of initial claims for unemployment insurance filed each week. An initial claim is “any notice of unemployment filed (1) to request a determination of entitlement to <strong>and</strong> eligibility for compensation or (2) to begin a second or subsequent period of eligibility within a benefit year or period of eligibility.”
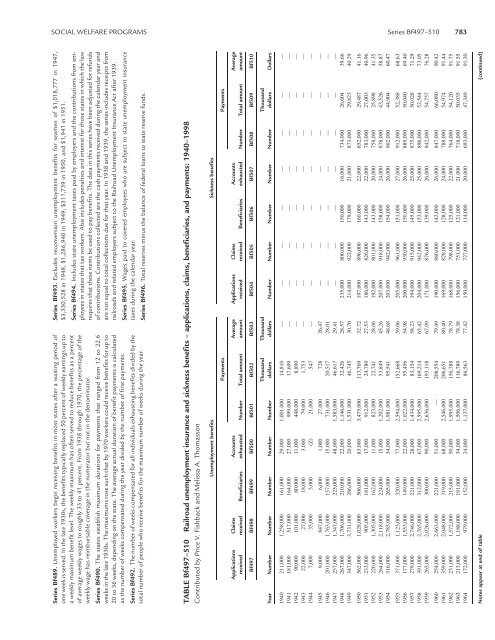
SOCIAL WELFARE PROGRAMS Series Bf497–510 783 Series Bf489. Unemployed workers begin receiving benefits in most states after a waiting period of one week is served. In the late 1930s, the benefits typically replaced 50 percent of weekly earnings up to a weekly maximum benefit level. The weekly maximum has often served to reduce benefits as a percent of average weekly wages to roughly 33 to 41 percent. From 1938 through 1970, the percentage of the weekly wage has reimbursable coverage in the numerator but not in the denominator. Series Bf490. The states establish maximum durations for payments that ranged from 12 to 22.6 weeks in the late 1930s. The maximums rose such that by 1970 workers could receive benefits for up to 20 to 36 weeks, depending on the state. The average actual duration of benefit payments is calculated as the number of weeks compensated during the year divided by the number of first payments. Series Bf492. The number of weeks compensated for all individuals exhausting benefits divided by the total number of people who receive benefits for the maximum number of weeks during the year. Series Bf493. Excludes reconversion unemployment benefits for seamen of $1,018,777 in 1947, $3,330,528 in 1948, $1,286,940 in 1949, $311,739 in 1950, <strong>and</strong> $1,941 in 1951. Series Bf494. Includes state unemployment taxes paid by employers <strong>and</strong> the contributions from employees in states that tax workers. Also includes penalties <strong>and</strong> interest for those states in which the law requires that these items be used to pay benefits. The data in this series have been adjusted for refunds of contributions. Contributions collected are the cash payments received during the calendar year <strong>and</strong> are not equal to total collections due for that year. In 1938 <strong>and</strong> 1939, the series includes receipts from railroads <strong>and</strong> related employers subject to the Railroad Unemployment <strong>Insurance</strong> Act after 1939. Series Bf495. Wages paid to covered employees who are subject to state unemployment insurance taxes during the calendar year. Series Bf496. Total reserves minus the balance of federal loans to state reserve funds. TABLE Bf497–510 Railroad unemployment insurance <strong>and</strong> sickness benefits – applications, claims, beneficiaries, <strong>and</strong> payments: 1940–1998 Contributed by Price V. Fishback <strong>and</strong> Melissa A. Thomasson Unemployment benefits Sickness benefits Payments Payments Applications Claims Accounts Average Applications Claims Accounts Average received received Beneficiaries exhausted Number Total amount amount received received Beneficiaries exhausted Number Total amount amount Bf497 Bf498 Bf499 Bf500 Bf501 Bf502 Bf503 Bf504 Bf505 Bf506 Bf507 Bf508 Bf509 Bf510 Thous<strong>and</strong> Thous<strong>and</strong> Thous<strong>and</strong> Year Number Number Number Number Number dollars dollars Number Number Number Number Number dollars Dollars 1940 211,000 1,258,000 161,000 29,000 1,001,000 14,810 — — — — — — — — 1941 181,000 517,000 164,000 27,000 999,000 17,699 — — — — — — — — 1942 90,000 101,000 80,000 11,000 448,000 8,890 — — — — — — — — 1943 22,000 27,000 18,000 3,000 79,000 1,753 — — — — — — — — 1944 7,000 35,000 5,000 (Z) 21,000 547 — — — — — — — — 1945 9,000 847,000 6,000 1,000 27,000 728 26.47 — — — — — — — 1946 201,000 1,763,000 157,000 15,000 731,000 20,517 28.01 — — — — — — — 1947 257,000 1,347,000 225,000 48,000 1,583,000 46,617 29.41 — — — — — — — 1948 267,000 1,706,000 210,000 22,000 1,146,000 32,426 28.57 235,000 800,000 150,000 16,000 734,000 26,604 39.66 1949 347,000 3,731,000 286,000 20,000 1,531,000 46,745 30.70 214,000 922,000 179,000 21,000 873,000 29,823 40.29 1950 562,000 1,028,000 506,000 83,000 3,475,000 113,769 32.72 197,000 896,000 160,000 22,000 852,000 29,487 41.16 1951 233,000 905,000 181,000 17,000 912,000 24,780 27.53 186,000 826,000 143,000 22,000 783,000 27,003 40.96 1952 220,000 1,305,000 162,000 11,000 823,000 22,741 28.06 192,000 801,000 143,000 20,000 758,000 25,898 41.35 1953 264,000 2,118,000 224,000 15,000 1,202,000 53,849 45.26 207,000 918,000 158,000 24,000 878,000 43,526 58.87 1954 316,000 2,785,000 265,000 34,000 1,981,000 95,541 48.68 203,000 942,000 154,000 26,000 902,000 44,904 60.47 1955 371,000 1,123,000 320,000 77,000 2,594,000 152,668 59.06 205,000 961,000 151,000 27,000 912,000 52,388 68.63 1956 177,000 1,553,000 149,000 22,000 1,022,000 55,456 54.98 200,000 930,000 150,000 26,000 889,000 50,040 69.40 1957 279,000 2,746,000 221,000 28,000 1,434,000 83,154 58.23 194,000 915,000 145,000 25,000 875,000 50,028 71.29 1958 391,000 2,765,000 312,000 67,000 2,595,000 169,214 65.42 204,000 942,000 153,000 25,000 896,000 52,544 73.05 1959 265,000 2,026,000 300,000 90,000 2,636,000 193,118 67.09 171,000 876,000 139,000 26,000 842,000 54,757 76.28 1960 254,000 2,663,000 221,000 51,000 — 208,554 79.49 190,000 880,000 142,000 26,000 847,000 66,080 90.42 1961 359,000 2,048,000 319,000 68,000 2,546,000 206,651 80.40 169,000 828,000 128,000 24,000 788,000 54,974 91.44 1962 231,000 1,572,000 215,000 50,000 1,995,000 156,788 78.79 168,000 798,000 125,000 22,000 764,000 54,120 91.75 1963 213,000 1,188,000 191,000 34,000 1,506,000 116,789 78.38 156,000 751,000 121,000 21,000 718,000 50,035 91.55 1964 172,000 979,000 152,000 24,000 1,137,000 86,563 77.42 150,000 727,000 114,000 20,000 693,000 47,349 91.30 Notes appear at end of table (continued)