

Social Insurance and Public Assistance
public-assistance-welfare-reform-colonial-times-to-the-present-ziliak ...
public-assistance-welfare-reform-colonial-times-to-the-present-ziliak ...

You also want an ePaper? Increase the reach of your titles
YUMPU automatically turns print PDFs into web optimized ePapers that Google loves.
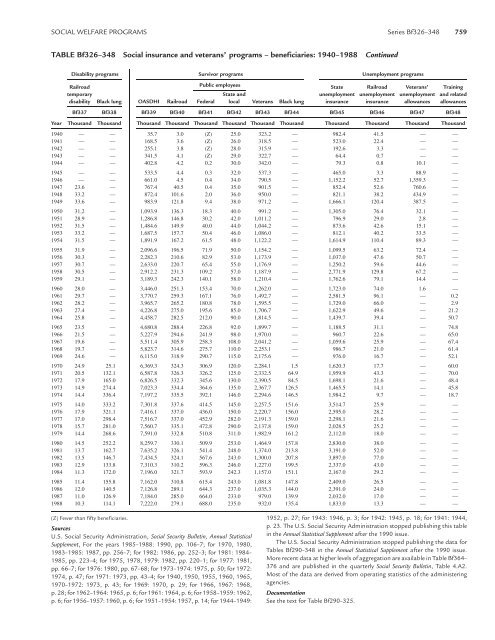
SOCIAL WELFARE PROGRAMS Series Bf326–348 759<br />
TABLE Bf326–348 <strong>Social</strong> insurance <strong>and</strong> veterans’ programs – beneficiaries: 1940–1988 Continued<br />
Disability programs Survivor programs Unemployment programs<br />
Railroad <strong>Public</strong> employees<br />
State Railroad Veterans’ Training<br />
temporary State <strong>and</strong> unemployment unemployment unemployment <strong>and</strong> related<br />
disability Black lung OASDHI Railroad Federal local Veterans Black lung insurance insurance allowances allowances<br />
Bf337 Bf338 Bf339 Bf340 Bf341 Bf342 Bf343 Bf344 Bf345 Bf346 Bf347 Bf348<br />
Year Thous<strong>and</strong> Thous<strong>and</strong> Thous<strong>and</strong> Thous<strong>and</strong> Thous<strong>and</strong> Thous<strong>and</strong> Thous<strong>and</strong> Thous<strong>and</strong> Thous<strong>and</strong> Thous<strong>and</strong> Thous<strong>and</strong> Thous<strong>and</strong><br />
1940 — — 35.7 3.0 (Z) 25.0 323.2 — 982.4 41.5 — —<br />
1941 — — 168.5 3.6 (Z) 26.0 318.5 — 523.0 22.4 — —<br />
1942 — — 255.1 3.8 (Z) 28.0 315.9 — 192.6 3.3 — —<br />
1943 — — 341.5 4.1 (Z) 29.0 322.7 — 64.4 0.7 — —<br />
1944 — — 402.8 4.2 0.2 30.0 342.0 — 79.3 0.8 10.1 —<br />
1945 — — 533.5 4.4 0.3 32.0 537.3 — 465.0 3.3 88.9 —<br />
1946 — — 661.0 4.5 0.4 34.0 790.5 — 1,152.2 52.7 1,359.3 —<br />
1947 23.6 — 767.4 40.5 0.4 35.0 901.5 — 852.4 52.6 760.6 —<br />
1948 33.2 — 872.4 101.6 2.0 36.0 950.0 — 821.1 38.2 434.9 —<br />
1949 33.6 — 983.9 121.8 9.4 38.0 971.2 — 1,666.1 120.4 387.5 —<br />
1950 31.2 — 1,093.9 136.3 18.3 40.0 991.2 — 1,305.0 76.4 32.1 —<br />
1951 28.9 — 1,286.8 146.8 30.2 42.0 1,011.2 — 796.9 29.0 2.8 —<br />
1952 31.5 — 1,484.6 149.9 40.0 44.0 1,044.2 — 873.6 42.6 15.1 —<br />
1953 33.2 — 1,687.5 157.7 50.4 46.0 1,086.0 — 812.1 40.2 33.5 —<br />
1954 31.5 — 1,891.9 167.2 61.5 48.0 1,122.2 — 1,614.9 110.4 89.3 —<br />
1955 31.9 — 2,096.6 196.5 71.9 50.0 1,154.2 — 1,099.5 63.2 72.4 —<br />
1956 30.3 — 2,282.3 210.6 82.9 53.0 1,173.9 — 1,037.0 47.6 50.7 —<br />
1957 30.7 — 2,633.0 220.7 65.4 55.0 1,176.9 — 1,250.2 59.6 44.6 —<br />
1958 30.5 — 2,912.2 231.3 109.2 57.0 1,187.9 — 2,771.9 129.8 67.2 —<br />
1959 29.1 — 3,189.3 242.3 140.1 58.0 1,210.4 — 1,762.6 79.1 14.4 —<br />
1960 28.0 — 3,446.0 251.3 153.4 70.0 1,262.0 — 1,723.0 74.0 1.6 —<br />
1961 29.7 — 3,770.7 259.3 167.1 76.0 1,492.7 — 2,581.5 96.1 — 0.2<br />
1962 28.2 — 3,965.7 265.2 180.8 78.0 1,595.5 — 1,729.0 66.0 — 2.9<br />
1963 27.4 — 4,226.8 275.0 195.6 85.0 1,706.7 — 1,622.9 49.6 — 21.2<br />
1964 25.8 — 4,458.7 282.5 212.0 90.0 1,814.5 — 1,439.7 39.4 — 50.7<br />
1965 23.5 — 4,680.8 288.4 226.8 92.0 1,899.7 — 1,188.5 31.1 — 74.8<br />
1966 21.5 — 5,227.9 294.6 241.9 98.0 1,970.0 — 960.7 22.6 — 65.0<br />
1967 19.6 — 5,511.4 305.9 258.3 108.0 2,041.2 — 1,059.6 25.9 — 67.4<br />
1968 19.7 — 5,823.7 314.6 275.7 110.0 2,253.1 — 986.7 21.0 — 61.4<br />
1969 24.6 — 6,115.0 318.9 290.7 115.0 2,175.6 — 976.0 16.7 — 52.1<br />
1970 24.9 25.1 6,369.3 324.3 306.9 120.0 2,284.1 1.5 1,620.3 17.7 — 60.0<br />
1971 20.5 132.1 6,587.8 326.3 326.2 125.0 2,332.5 64.9 1,959.9 43.3 — 70.0<br />
1972 17.9 165.0 6,826.5 332.3 345.6 130.0 2,390.5 84.5 1,698.1 21.6 — 48.4<br />
1973 14.9 274.4 7,023.3 334.4 364.6 135.0 2,367.7 126.5 1,465.5 14.1 — 45.8<br />
1974 14.4 336.4 7,197.2 335.5 392.1 146.0 2,294.6 146.5 1,984.2 9.7 — 18.7<br />
1975 14.0 333.2 7,301.8 337.6 414.5 145.0 2,257.5 151.6 3,514.7 25.9 — —<br />
1976 17.9 321.1 7,416.1 337.0 436.0 150.0 2,220.7 156.0 2,595.0 28.2 — —<br />
1977 17.0 298.4 7,516.7 337.0 452.9 282.0 2,191.3 159.0 2,298.1 21.6 — —<br />
1978 15.7 281.0 7,560.7 335.1 472.8 290.0 2,137.8 159.0 2,028.5 25.2 — —<br />
1979 14.4 268.6 7,591.0 332.8 510.8 311.0 1,982.9 161.2 2,112.0 18.0 — —<br />
1980 14.5 252.2 8,259.7 330.1 509.9 253.0 1,464.9 157.8 2,830.0 38.0 — —<br />
1981 13.7 162.7 7,635.2 326.1 541.4 248.0 1,374.0 213.8 3,191.0 52.0 — —<br />
1982 13.5 146.7 7,434.5 324.1 567.6 243.0 1,300.0 207.8 3,897.0 77.0 — —<br />
1983 12.9 133.8 7,310.3 310.2 596.3 246.0 1,227.0 199.5 2,337.0 43.0 — —<br />
1984 11.3 172.0 7,196.0 321.7 593.9 242.3 1,157.0 151.1 2,167.0 29.2 — —<br />
1985 11.4 155.8 7,162.0 310.8 615.4 243.0 1,081.8 147.8 2,409.0 26.5 — —<br />
1986 12.0 140.5 7,126.8 289.1 644.3 237.0 1,035.3 144.0 2,391.0 24.0 — —<br />
1987 11.0 126.9 7,184.0 285.0 664.0 233.0 979.0 139.9 2,032.0 17.0 — —<br />
1988 10.3 114.1 7,222.0 279.1 688.0 235.0 932.0 135.4 1,833.0 13.3 — —<br />
(Z) Fewer than fifty beneficiaries.<br />
Sources<br />
U.S. <strong>Social</strong> Security Administration, <strong>Social</strong> Security Bulletin, Annual Statistical<br />
Supplement, For the years 1985–1988: 1990, pp. 106–7; for 1970, 1980,<br />
1983–1985: 1987, pp. 256–7; for 1982: 1986, pp. 252–3; for 1981: 1984–<br />
1985, pp. 223–4; for 1975, 1978, 1979: 1982, pp. 220–1; for 1977: 1981,<br />
pp. 66–7; for 1976: 1980, pp. 67–68; for 1973–1974: 1975, p. 50; for 1972:<br />
1974, p. 47; for 1971: 1973, pp. 43–4; for 1940, 1950, 1955, 1960, 1965,<br />
1970–1972: 1973, p. 43; for 1969: 1970, p. 29; for 1966, 1967: 1968,<br />
p. 28; for 1962–1964: 1965, p. 6; for 1961: 1964, p. 6; for 1958–1959: 1962,<br />
p. 6; for 1956–1957: 1960, p. 6; for 1951–1954: 1957, p. 14; for 1944–1949:<br />
1952, p. 27; for 1943: 1946, p. 3; for 1942: 1945, p. 18; for 1941: 1944,<br />
p. 23. The U.S. <strong>Social</strong> Security Administration stopped publishing this table<br />
in the Annual Statistical Supplement after the 1990 issue.<br />
The U.S. <strong>Social</strong> Security Administration stopped publishing the data for<br />
Tables Bf290–348 in the Annual Statistical Supplement after the 1990 issue.<br />
More recent data at higher levels of aggregation are available in Table Bf364–<br />
376 <strong>and</strong> are published in the quarterly <strong>Social</strong> Security Bulletin, Table 4.A2.<br />
Most of the data are derived from operating statistics of the administering<br />
agencies.<br />
Documentation<br />
See the text for Table Bf290–325.


