- Page 1 and 2:
National Institute on Drug Abuse RE
- Page 3 and 4:
ACKNOWLEDGMENT This monograph is ba
- Page 5 and 6:
Drug Use and HIV Risk Among Male Se
- Page 7 and 8:
Partners. The review was held April
- Page 9 and 10:
Inciardi, J.A.; Lockwood, D.; and P
- Page 11 and 12:
highlights the critical importance
- Page 13 and 14:
AUTHOR Richard H. Needle, Ph.D., M.
- Page 15 and 16:
Blower and colleagues (1991) have p
- Page 17 and 18:
Even in areas with low seroprevalen
- Page 19 and 20:
involves using a syringe to draw bl
- Page 21 and 22:
Hispanics were less likely to repor
- Page 23 and 24:
victimization through theft, violen
- Page 25 and 26:
sharing? When are needles deliberat
- Page 27 and 28:
Chitwood, D.D.; McCoy, C.B.; Inciar
- Page 29 and 30:
Page, J.B.; Smith, P.C.; and Kane,
- Page 31 and 32:
HIV/AIDS Risks Among Male, Heterose
- Page 33 and 34:
during that time, and the possibili
- Page 35 and 36:
All of these issues and considerati
- Page 37 and 38:
ecoming the norm for both male and
- Page 39 and 40:
the skin on his penis while having
- Page 41 and 42:
REFERENCES Ball, J.C., and Chambers
- Page 43 and 44: Johnson, A.M.; Petherick, A.; David
- Page 45 and 46: Vogt, M.W.; Craven, D.E.; Crawford,
- Page 47 and 48: transmission from males to females
- Page 49 and 50: (this volume), there is little atte
- Page 51 and 52: Clayton, R.; Voss, H.; Robbins, C.;
- Page 53 and 54: Female Drug Abusers and the Context
- Page 55 and 56: have the data but interpret it supe
- Page 57 and 58: important to examine current studie
- Page 59 and 60: found in this study was low socioec
- Page 61 and 62: who trade sex for crack; and simila
- Page 63 and 64: esponsibilities in perspective. Suc
- Page 65 and 66: Robles and colleagues (1990) examin
- Page 67 and 68: The lack of rational thought separa
- Page 69 and 70: Factors Associated With Sexual Risk
- Page 71 and 72: Factors Associated With Poverty A n
- Page 73 and 74: encouraging such women to leave the
- Page 75 and 76: Hispanic women but extramarital aff
- Page 77 and 78: coherence—the sense that life is
- Page 79 and 80: the change agent may be a crucial f
- Page 81 and 82: Centers for Disease Control and Pre
- Page 83 and 84: Jemmott, J.B.; Jemmott, L.S.; Spear
- Page 85 and 86: O’Leary, A.; Celentano, D.; Maiba
- Page 87 and 88: Drug Use and HIV Risk Among Gay and
- Page 89 and 90: with 34.6 percent of gay men and 28
- Page 91 and 92: found among both hustlers and call
- Page 93: Substance Use and HIV-Transmitting
- Page 97 and 98: less than 2 percent of participants
- Page 99 and 100: TABLE 2. Quantity of alcohol use am
- Page 101 and 102: A fourth study of gay/bisexual men,
- Page 103 and 104: in mind, however, that most of the
- Page 105 and 106: seropositivity and reported NMPD us
- Page 107 and 108: interaction and education than men
- Page 109 and 110: Geographic differences found in the
- Page 111 and 112: that they are intending or desirous
- Page 113 and 114: enough is known in general about th
- Page 115 and 116: REFERENCES Calzavara, L.M.; Coates,
- Page 117 and 118: Ostrow, D.G.; Beltran, E.; Chmiel,
- Page 119 and 120: Drug Use and HIV Risk Among Male Se
- Page 121 and 122: prostitutes were HIV positive, as c
- Page 123 and 124: Trade hustlers are usually heterose
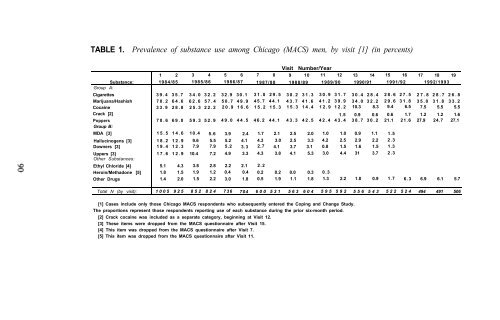
- Page 125 and 126: TABLE 1. Number of Completed Interv
- Page 127 and 128: diagnosed slightly more often than
- Page 129 and 130: TABLE 2. Injection Drug Use by Type
- Page 131 and 132: By the 100th interview, the screeni
- Page 133 and 134: SUMMARY AND CONCLUSIONS In general,
- Page 135 and 136: Plant, M. Sex work, alcohol, drugs
- Page 137 and 138: HIV Risk in Drug-Using Adolescents
- Page 139 and 140: AUTHOR Vincent L. Smeriglio, Ph.D.
- Page 141 and 142: comprise 23 percent of all adolesce
- Page 143 and 144: 232 (18 percent) of the cases; and
- Page 145 and 146:
Although these data provide an over
- Page 147 and 148:
Most of these were unprotected sexu
- Page 149 and 150:
national epidemiologic survey of hi
- Page 151 and 152:
Hawkins et al. 1992; Newcomb et al.
- Page 153 and 154:
higher rates of HIV/AIDS in adolesc
- Page 155 and 156:
Boyer, C.B. Psychosocial, behaviora
- Page 157 and 158:
Irwin, C.E., Jr., and Shafer, M.A.
- Page 159 and 160:
Zweig Greenberg, MS.; Singh, T.; Ht
- Page 161 and 162:
the types of intervention strategie
- Page 163 and 164:
from a study group of 52 youths who
- Page 165 and 166:
forearm during a sexual episode. At
- Page 167 and 168:
I was nice looking, like I can do a
- Page 169 and 170:
It is unclear whether the disinhibi
- Page 171 and 172:
continual sexual dysfunction was re
- Page 173 and 174:
TWEAKING, FREAKING, AND OVER-AMPING
- Page 175 and 176:
highway of love. It’s like, I’d
- Page 177 and 178:
Unprotected sexual activity is more
- Page 179 and 180:
alternatives and opportunities, and
- Page 181 and 182:
the night and food for the morning.
- Page 183 and 184:
7. also can help youths explore and
- Page 185 and 186:
Jessor, R., and Jessor, S.L. Proble
- Page 187 and 188:
AUTHORS Mary Jane Rotheram-Borus, P
- Page 189 and 190:
Brunswick goes on to discuss the le
- Page 191 and 192:
permission-giving introductions to
- Page 193 and 194:
conversion and perhaps even serocon
- Page 195 and 196:
TABLE 1. Ecological paradigm of con
- Page 197 and 198:
TECHNICAL ISSUES Technical issues i
- Page 199 and 200:
eliability. It seems obvious that q
- Page 201 and 202:
sometimes as many as three zip code
- Page 203 and 204:
Resources and effort are required t
- Page 205 and 206:
Brunswick, A.F.; Lewis, C.S.; and M
- Page 207 and 208:
The Context of Risk: Ethnographic C
- Page 209 and 210:
same meaning may be extended to dru
- Page 211 and 212:
THE CONTEXT OF RISK Context is an a
- Page 213 and 214:
hurried, and adequate needle cleani
- Page 215 and 216:
degrading sexual acts, poignantly m
- Page 217 and 218:
searched me and I had stashed the c
- Page 219 and 220:
REFERENCES Agar, M. The Professiona
- Page 221 and 222:
Ouellet, L. J.; Jimenez, A.D.; John
- Page 223 and 224:
Assessing the Reliability and Valid
- Page 225 and 226:
TABLE 1. Sociodemographic profile o
- Page 227 and 228:
Table 2 shows percentage agreement
- Page 229 and 230:
FORENSIC TECHNIQUES TO DOCUMENT SEL
- Page 231 and 232:
cross-tabulated with dichotomous me
- Page 233 and 234:
TABLE 6. Relationship of question t
- Page 235 and 236:
aggravate self-presentation bias. T
- Page 237 and 238:
TABLE 8. Percent of subjects report
- Page 239 and 240:
intercourse, and since anal interco
- Page 241 and 242:
Future Directions for Studies on th
- Page 243 and 244:
abusers, and other variables are ne
- Page 245 and 246:
Behavior patterns can be clarified
- Page 247 and 248:
As Des Jarlais noted, designs and a
- Page 249 and 250:
strengths within a setting or indiv
- Page 251 and 252:
National Institute on While limited
- Page 253 and 254:
62 NEUROSCIENCE METHODS IN DRUG ABU
- Page 255 and 256:
89 BIOLOGICAL VULNERABILITY TO DRUG
- Page 257 and 258:
111 MOLECULAR APPROACHES TO DRUG AB
- Page 259 and 260:
127 PROGRESS AND ISSUES IN CASE MAN
- Page 261:
NIH Publication No. 94-3750 Printed