mag
You also want an ePaper? Increase the reach of your titles
YUMPU automatically turns print PDFs into web optimized ePapers that Google loves.
Malaysia Water Research Journal<br />
for Skudai River was generated by using Automatic Sample Pump ISCO 6712<br />
(Teledyne ISCO, 2012) that collected water level data every week. During high<br />
flows, the sample nozzle pump was submerged at the bottom of the river to<br />
determine an exact of total suspended solids had been collected. Subsequently,<br />
after sufficient data have been collected, linear correlation analysis between<br />
flow and total suspended solids were estimated.<br />
The statistical analysis of hourly observed and simulated runoff were defined<br />
using linear regression (coefficient of determination, R2), Nash-Sutcliffe efficiency<br />
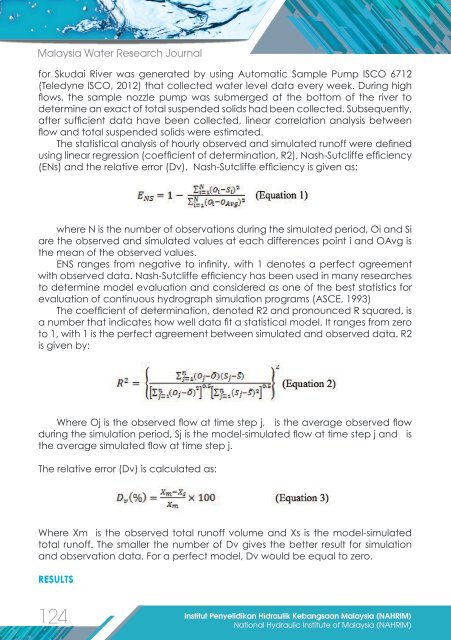
(ENs) and the relative error (Dv). Nash-Sutcliffe efficiency is given as:<br />
where N is the number of observations during the simulated period, Oi and Si<br />
are the observed and simulated values at each differences point i and OAvg is<br />
the mean of the observed values.<br />
ENS ranges from negative to infinity, with 1 denotes a perfect agreement<br />
with observed data. Nash-Sutcliffe efficiency has been used in many researches<br />
to determine model evaluation and considered as one of the best statistics for<br />
evaluation of continuous hydrograph simulation programs (ASCE, 1993)<br />
The coefficient of determination, denoted R2 and pronounced R squared, is<br />
a number that indicates how well data fit a statistical model. It ranges from zero<br />
to 1, with 1 is the perfect agreement between simulated and observed data. R2<br />
is given by:<br />
Where Oj is the observed flow at time step j, is the average observed flow<br />
during the simulation period, Sj is the model-simulated flow at time step j and is<br />
the average simulated flow at time step j.<br />
The relative error (Dv) is calculated as:<br />
Where Xm is the observed total runoff volume and Xs is the model-simulated<br />
total runoff. The smaller the number of Dv gives the better result for simulation<br />
and observation data. For a perfect model, Dv would be equal to zero.<br />
RESULTS<br />
124<br />
Institut Penyelidikan Hidraulik Kebangsaan Malaysia (NAHRIM)<br />
National Hydraulic Institute of Malaysia (NAHRIM)


