

mag

Create successful ePaper yourself
Turn your PDF publications into a flip-book with our unique Google optimized e-Paper software.
Malaysia Water Research Journal<br />
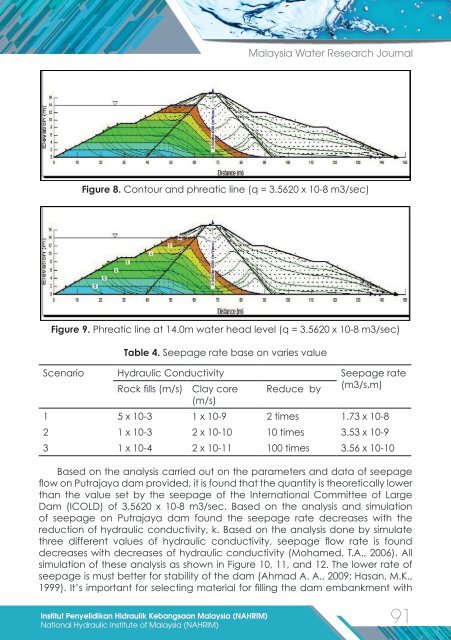
Figure 8. Contour and phreatic line (q = 3.5620 x 10⁻⁸ m3/sec)<br />
Figure 9. Phreatic line at 14.0m water head level (q = 3.5620 x 10⁻⁸ m3/sec)<br />
Table 4. Seepage rate base on varies value<br />
Scenario Hydraulic Conductivity Seepage rate<br />
Rock fills (m/s) Clay core<br />
(m/s)<br />
Reduce by<br />
(m3/s.m)<br />
1 5 x 10⁻³ 1 x 10⁻⁹ 2 times 1.73 x 10-8<br />
2 1 x 10⁻³ 2 x 10⁻¹⁰ 10 times 3.53 x 10-9<br />
3 1 x 10⁻⁴ 2 x 10-11 100 times 3.56 x 10-10<br />
Based on the analysis carried out on the parameters and data of seepage<br />
flow on Putrajaya dam provided, it is found that the quantity is theoretically lower<br />
than the value set by the seepage of the International Committee of Large<br />
Dam (ICOLD) of 3.5620 x 10⁻⁸ m3/sec. Based on the analysis and simulation<br />
of seepage on Putrajaya dam found the seepage rate decreases with the<br />
reduction of hydraulic conductivity, k. Based on the analysis done by simulate<br />
three different values of hydraulic conductivity, seepage flow rate is found<br />
decreases with decreases of hydraulic conductivity (Mohamed, T.A., 2006). All<br />
simulation of these analysis as shown in Figure 10, 11, and 12. The lower rate of<br />
seepage is must better for stability of the dam (Ahmad A. A., 2009; Hasan, M.K.,<br />
1999). It’s important for selecting material for filling the dam embankment with<br />
Institut Penyelidikan Hidraulik Kebangsaan Malaysia (NAHRIM)<br />
91<br />
National Hydraulic Institute of Malaysia (NAHRIM)