

mag

You also want an ePaper? Increase the reach of your titles
YUMPU automatically turns print PDFs into web optimized ePapers that Google loves.
4 RESULT AND DISCUSSION<br />
4.1 Field Measurement<br />
Malaysia Water Research Journal<br />
The highest speed measured during the measurement period at the observed<br />
location A and B, respectively were 0.33 m/s and 0.25 m/s. While the lowest<br />
reading for the measured current speed were 0.03 and 0.04 m/s. Analysis of the<br />
observed data for the current direction showed that the current flows in the 200⁰<br />
and 10⁰ directions in location A and while the dominant flow is at 320⁰ and 180⁰<br />
in location B. Wave data analysis showed the dominant wave direction is 80⁰ to<br />
120⁰ in location A and 120º to 140º at location B. Location A indicates the wave<br />
height up to 0.4 m while the maximum wave height at location B exceeded<br />
0.6 m. Contours show the mainland area has heights exceeding 7.5 m and the<br />
sea has depth exceeding 25 m towards offshore and become shallower when<br />
approaching the coastline.<br />
4.2 Historical Bed Level Changes<br />
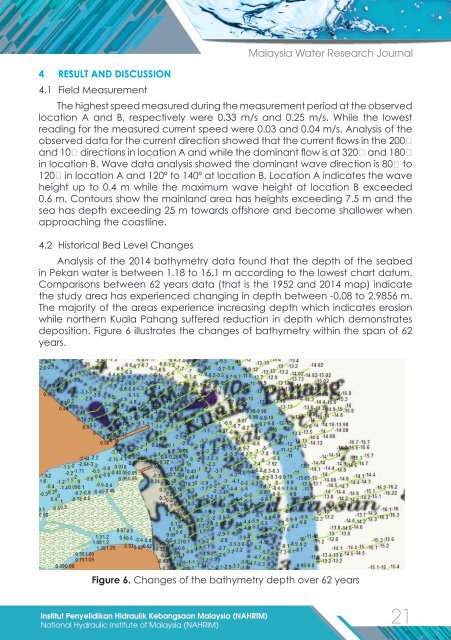
Analysis of the 2014 bathymetry data found that the depth of the seabed<br />
in Pekan water is between 1.18 to 16.1 m according to the lowest chart datum.<br />
Comparisons between 62 years data (that is the 1952 and 2014 map) indicate<br />
the study area has experienced changing in depth between -0.08 to 2.9856 m.<br />
The majority of the areas experience increasing depth which indicates erosion<br />
while northern Kuala Pahang suffered reduction in depth which demonstrates<br />
deposition. Figure 6 illustrates the changes of bathymetry within the span of 62<br />
years.<br />
Figure 6. Changes of the bathymetry depth over 62 years<br />
Institut Penyelidikan Hidraulik Kebangsaan Malaysia (NAHRIM)<br />
21<br />
National Hydraulic Institute of Malaysia (NAHRIM)