

mag

Create successful ePaper yourself
Turn your PDF publications into a flip-book with our unique Google optimized e-Paper software.
Malaysia Water Research Journal<br />
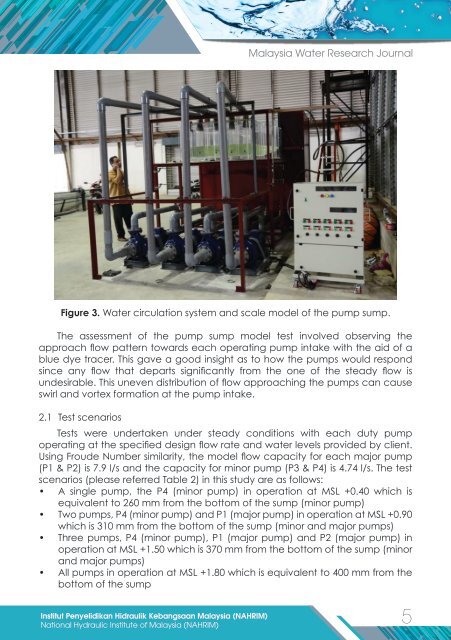
Figure 3. Water circulation system and scale model of the pump sump.<br />
The assessment of the pump sump model test involved observing the<br />
approach flow pattern towards each operating pump intake with the aid of a<br />
blue dye tracer. This gave a good insight as to how the pumps would respond<br />
since any flow that departs significantly from the one of the steady flow is<br />
undesirable. This uneven distribution of flow approaching the pumps can cause<br />
swirl and vortex formation at the pump intake.<br />
2.1 Test scenarios<br />
Tests were undertaken under steady conditions with each duty pump<br />
operating at the specified design flow rate and water levels provided by client.<br />
Using Froude Number similarity, the model flow capacity for each major pump<br />
(P1 & P2) is 7.9 l/s and the capacity for minor pump (P3 & P4) is 4.74 l/s. The test<br />
scenarios (please referred Table 2) in this study are as follows:<br />
• A single pump, the P4 (minor pump) in operation at MSL +0.40 which is<br />
equivalent to 260 mm from the bottom of the sump (minor pump)<br />
• Two pumps, P4 (minor pump) and P1 (major pump) in operation at MSL +0.90<br />
which is 310 mm from the bottom of the sump (minor and major pumps)<br />
• Three pumps, P4 (minor pump), P1 (major pump) and P2 (major pump) in<br />
operation at MSL +1.50 which is 370 mm from the bottom of the sump (minor<br />
and major pumps)<br />
• All pumps in operation at MSL +1.80 which is equivalent to 400 mm from the<br />
bottom of the sump<br />
Institut Penyelidikan Hidraulik Kebangsaan Malaysia (NAHRIM)<br />
5<br />
National Hydraulic Institute of Malaysia (NAHRIM)