

mag

Create successful ePaper yourself
Turn your PDF publications into a flip-book with our unique Google optimized e-Paper software.
Malaysia Water Research Journal<br />
Table 2. Water level station<br />
Station Latitude Longitude<br />
WL A 3° 31' 50.400" N 103° 27' 44.000" E<br />
WL B 3° 48' 35.600" N 103° 20' 09.800" E<br />
3.3 Numerical Model<br />
Analysis of the historical changes in bathymetry of the study area was carried<br />
out by making a comparison between the observed bathymetric data in 1952<br />
and 2014. The bathymetric data for year 1952 is presented in fathoms unit, where<br />
1.0 fathoms unit is approximately 1.83 m. Analysis of morphological changes<br />
were implemented by using Geographic Information System (GIS) of ArcMap<br />
version 10.1. Subsequent conversion unit was done to enable comparisons to be<br />
made. MIKE 21 software (DHI) was used in this study. The module hydrodynamic<br />
(HD), spectral wave (SW) was utilized for the analysis of wave, whereas sediment<br />
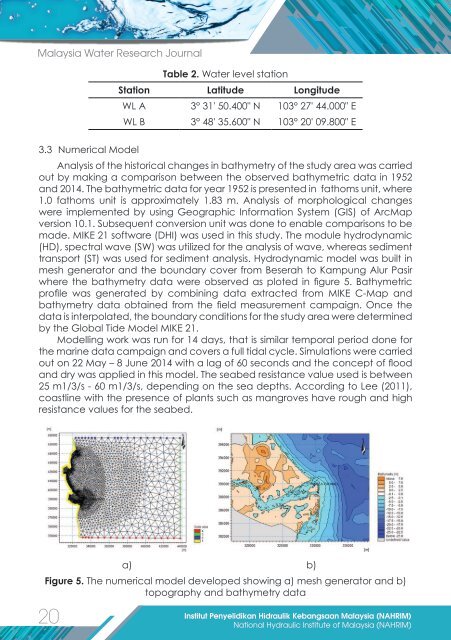
transport (ST) was used for sediment analysis. Hydrodynamic model was built in<br />
mesh generator and the boundary cover from Beserah to Kampung Alur Pasir<br />
where the bathymetry data were observed as ploted in figure 5. Bathymetric<br />
profile was generated by combining data extracted from MIKE C-Map and<br />
bathymetry data obtained from the field measurement campaign. Once the<br />
data is interpolated, the boundary conditions for the study area were determined<br />
by the Global Tide Model MIKE 21.<br />
Modelling work was run for 14 days, that is similar temporal period done for<br />
the marine data campaign and covers a full tidal cycle. Simulations were carried<br />
out on 22 May – 8 June 2014 with a lag of 60 seconds and the concept of flood<br />
and dry was applied in this model. The seabed resistance value used is between<br />
25 m1/3/s - 60 m1/3/s, depending on the sea depths. According to Lee (2011),<br />
coastline with the presence of plants such as mangroves have rough and high<br />
resistance values for the seabed.<br />
20<br />
a) b)<br />
Figure 5. The numerical model developed showing a) mesh generator and b)<br />
topography and bathymetry data<br />
Institut Penyelidikan Hidraulik Kebangsaan Malaysia (NAHRIM)<br />
National Hydraulic Institute of Malaysia (NAHRIM)