

mag

You also want an ePaper? Increase the reach of your titles
YUMPU automatically turns print PDFs into web optimized ePapers that Google loves.
Malaysia Water Research Journal<br />
data analysis can help to anticipate crisis or reduce the risks that would arise<br />
(Emmanouil and Nikolaos, 2015). The findings from NAHRIM (2014) indicate<br />
that future rainstorms will change in temporal and spatial variability which are<br />
mirrored in the formation of runoff and streamflow leading to intensification of<br />
floods and droughts.<br />
Predictive analytics in N-HyDAA functions enable data mining and extractions<br />
of possible future rainfall trends, patterns and <strong>mag</strong>nitude at either yearly, monthly<br />
or even weekly basis, and based on each climate change scenarios concerned.<br />
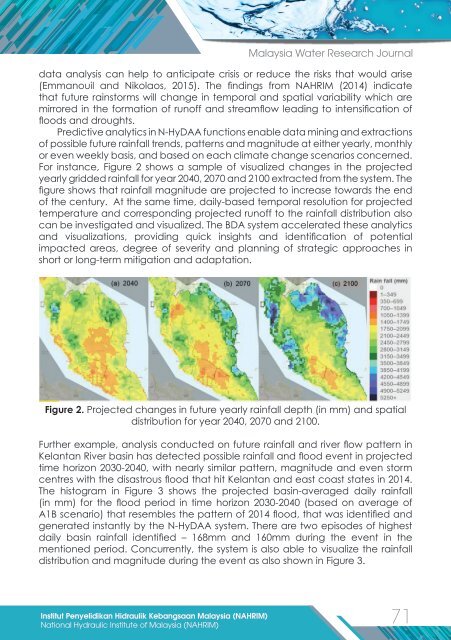
For instance, Figure 2 shows a sample of visualized changes in the projected<br />
yearly gridded rainfall for year 2040, 2070 and 2100 extracted from the system. The<br />
figure shows that rainfall <strong>mag</strong>nitude are projected to increase towards the end<br />
of the century. At the same time, daily-based temporal resolution for projected<br />
temperature and corresponding projected runoff to the rainfall distribution also<br />
can be investigated and visualized. The BDA system accelerated these analytics<br />
and visualizations, providing quick insights and identification of potential<br />
impacted areas, degree of severity and planning of strategic approaches in<br />
short or long-term mitigation and adaptation.<br />
Figure 2. Projected changes in future yearly rainfall depth (in mm) and spatial<br />
distribution for year 2040, 2070 and 2100.<br />
Further example, analysis conducted on future rainfall and river flow pattern in<br />
Kelantan River basin has detected possible rainfall and flood event in projected<br />
time horizon 2030-2040, with nearly similar pattern, <strong>mag</strong>nitude and even storm<br />
centres with the disastrous flood that hit Kelantan and east coast states in 2014.<br />
The histogram in Figure 3 shows the projected basin-averaged daily rainfall<br />
(in mm) for the flood period in time horizon 2030-2040 (based on average of<br />
A1B scenario) that resembles the pattern of 2014 flood, that was identified and<br />
generated instantly by the N-HyDAA system. There are two episodes of highest<br />
daily basin rainfall identified – 168mm and 160mm during the event in the<br />
mentioned period. Concurrently, the system is also able to visualize the rainfall<br />
distribution and <strong>mag</strong>nitude during the event as also shown in Figure 3.<br />
Institut Penyelidikan Hidraulik Kebangsaan Malaysia (NAHRIM)<br />
71<br />
National Hydraulic Institute of Malaysia (NAHRIM)