mag
Create successful ePaper yourself
Turn your PDF publications into a flip-book with our unique Google optimized e-Paper software.
4 RESULT AND DISCUSSION<br />
4.1 Flood Map<br />
Malaysia Water Research Journal<br />
The flood maps were produced based on the 50-year, 100-year and Probable<br />
Maximum Precipitation (PMP) data. The objective is to produce flood forecasting<br />
map using real-time simulation that can evaluate and assess the flood da<strong>mag</strong>e<br />
caused by flooding. These rainfall events occurred for two (2) hours duration. The<br />
rainfall intensities for 50- and 100-year are obtained from DID (2012) and PMP is<br />
obtained from NAHRIM (2008). Kirpich’s formula is used to calculate the rainfall<br />
duration.<br />
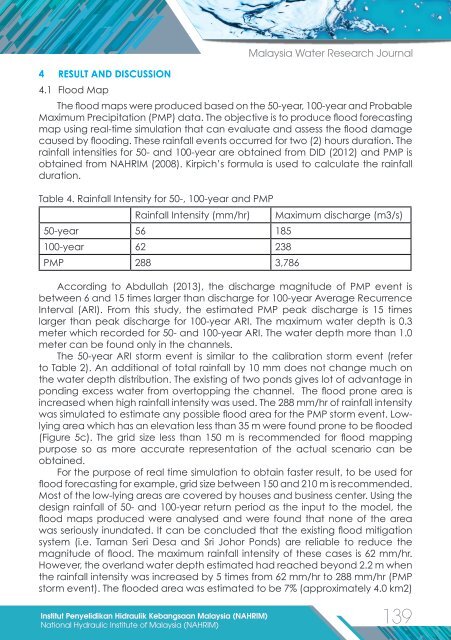
Table 4. Rainfall Intensity for 50-, 100-year and PMP<br />
Rainfall Intensity (mm/hr)<br />
50-year 56 185<br />
100-year 62 238<br />
PMP 288 3,786<br />
Maximum discharge (m3/s)<br />
According to Abdullah (2013), the discharge <strong>mag</strong>nitude of PMP event is<br />
between 6 and 15 times larger than discharge for 100-year Average Recurrence<br />
Interval (ARI). From this study, the estimated PMP peak discharge is 15 times<br />
larger than peak discharge for 100-year ARI. The maximum water depth is 0.3<br />
meter which recorded for 50- and 100-year ARI. The water depth more than 1.0<br />
meter can be found only in the channels.<br />
The 50-year ARI storm event is similar to the calibration storm event (refer<br />
to Table 2). An additional of total rainfall by 10 mm does not change much on<br />
the water depth distribution. The existing of two ponds gives lot of advantage in<br />
ponding excess water from overtopping the channel. The flood prone area is<br />
increased when high rainfall intensity was used. The 288 mm/hr of rainfall intensity<br />
was simulated to estimate any possible flood area for the PMP storm event. Lowlying<br />
area which has an elevation less than 35 m were found prone to be flooded<br />
(Figure 5c). The grid size less than 150 m is recommended for flood mapping<br />
purpose so as more accurate representation of the actual scenario can be<br />
obtained.<br />
For the purpose of real time simulation to obtain faster result, to be used for<br />
flood forecasting for example, grid size between 150 and 210 m is recommended.<br />
Most of the low-lying areas are covered by houses and business center. Using the<br />
design rainfall of 50- and 100-year return period as the input to the model, the<br />
flood maps produced were analysed and were found that none of the area<br />
was seriously inundated. It can be concluded that the existing flood mitigation<br />
system (i.e. Taman Seri Desa and Sri Johor Ponds) are reliable to reduce the<br />
<strong>mag</strong>nitude of flood. The maximum rainfall intensity of these cases is 62 mm/hr.<br />
However, the overland water depth estimated had reached beyond 2.2 m when<br />
the rainfall intensity was increased by 5 times from 62 mm/hr to 288 mm/hr (PMP<br />
storm event). The flooded area was estimated to be 7% (approximately 4.0 km2)<br />
Institut Penyelidikan Hidraulik Kebangsaan Malaysia (NAHRIM)<br />
139<br />
National Hydraulic Institute of Malaysia (NAHRIM)


