

ROOM AT THE TABLE - Intersight - University at Buffalo
ROOM AT THE TABLE - Intersight - University at Buffalo
ROOM AT THE TABLE - Intersight - University at Buffalo

You also want an ePaper? Increase the reach of your titles
YUMPU automatically turns print PDFs into web optimized ePapers that Google loves.
HOUSEHOLD STRUCTURE<br />
Among the 383,164 households in Erie County, there are various<br />
household structures with the most common one being ‘family.’ In recent<br />
years, however, ‘nonfamily households’ are becoming increasingly<br />
common in Erie County. Between 2000 and 2010, the proportion of nonfamily<br />
households grew from 36 percent to 40 percent (See Table 1.1).<br />
Among family households, the majority is comprised of married<br />
couples (70%). 8 Families headed by a single mother comprise 23 percent of<br />
all family households.<br />
INCOME AND POVERTY<br />
The median household income is increasing in Erie County. It<br />
was $46,609 in 2009, 9 an increase of 22 percent from the $38,211 income<br />
reported in 2000. 10 This increase is slightly smaller than New York St<strong>at</strong>e’s,<br />
where household income increased by 27 percent over the same time period<br />
from $43,393 to $55,233. 11<br />
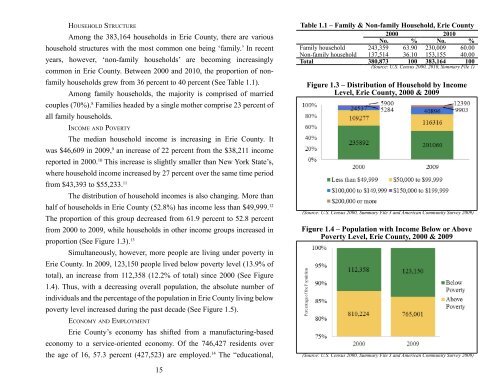
The distribution of household incomes is also changing. More than<br />
half of households in Erie County (52.8%) has income less than $49,999. 12<br />
The proportion of this group decreased from 61.9 percent to 52.8 percent<br />
from 2000 to 2009, while households in other income groups increased in<br />
proportion (See Figure 1.3). 13<br />
Simultaneously, however, more people are living under poverty in<br />
Erie County. In 2009, 123,150 people lived below poverty level (13.9% of<br />
total), an increase from 112,358 (12.2% of total) since 2000 (See Figure<br />
1.4). Thus, with a decreasing overall popul<strong>at</strong>ion, the absolute number of<br />
individuals and the percentage of the popul<strong>at</strong>ion in Erie County living below<br />
poverty level increased during the past decade (See Figure 1.5).<br />
ECONOMY AND EMPLOYMENT<br />
Erie County’s economy has shifted from a manufacturingbased<br />
economy to a serviceoriented economy. Of the 746,427 residents over<br />
the age of 16, 57.3 percent (427,523) are employed. 14 The “educ<strong>at</strong>ional,<br />
15<br />
Table 1.1 – Family & Nonfamily Household, Erie County<br />
2000 2010<br />
No. % No. %<br />
Family household 243,359 63.90 230,009 60.00<br />
Nonfamily household 137,514 36.10 153,155 40.00<br />
Total 380,873 100 383,164 100<br />
(Source: U.S. Census 2000, 2010, Summary File 1)<br />
Figure 1.3 – Distribution of Household by Income<br />
Level, Erie County, 2000 & 2009<br />
(Source: U.S. Census 2000, Summary File 3 and American Community Survey 2009)<br />
Figure 1.4 – Popul<strong>at</strong>ion with Income Below or Above<br />
Poverty Level, Erie County, 2000 & 2009<br />
(Source: U.S. Census 2000, Summary File 3 and American Community Survey 2009)