

ROOM AT THE TABLE - Intersight - University at Buffalo
ROOM AT THE TABLE - Intersight - University at Buffalo
ROOM AT THE TABLE - Intersight - University at Buffalo

You also want an ePaper? Increase the reach of your titles
YUMPU automatically turns print PDFs into web optimized ePapers that Google loves.
a certain type of food, divided by the amount of th<strong>at</strong> food required by the<br />
popul<strong>at</strong>ion.<br />
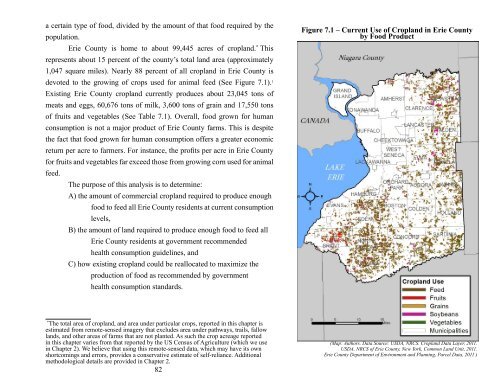
Erie County is home to about 99,445 acres of cropland. *1This represents about 15 percent of the county’s total land area (approxim<strong>at</strong>ely<br />
1,047 square miles). Nearly 88 percent of all cropland in Erie County is<br />
devoted to the growing of crops used for animal feed (See Figure 7.1). 1<br />
Existing Erie County cropland currently produces about 23,045 tons of<br />
me<strong>at</strong>s and eggs, 60,676 tons of milk, 3,600 tons of grain and 17,550 tons<br />
of fruits and vegetables (See Table 7.1). Overall, food grown for human<br />
consumption is not a major product of Erie County farms. This is despite<br />
the fact th<strong>at</strong> food grown for human consumption offers a gre<strong>at</strong>er economic<br />
+'/%+#(B'+(0!+'(/"(.0+&'+$6(e"+(,#$/0#!'E(/4'(B+")/$(B'+(0!+'(,#(N+,'(7"%#/5(<br />
for fruits and vegetables far exceed those from growing corn used for animal<br />
feed.<br />
The purpose of this analysis is to determine:<br />
A) the amount of commercial cropland required to produce enough<br />
food to feed all Erie County residents <strong>at</strong> current consumption<br />
levels,<br />
B) the amount of land required to produce enough food to feed all<br />
Erie County residents <strong>at</strong> government recommended<br />
health consumption guidelines, and<br />
C) how existing cropland could be realloc<strong>at</strong>ed to maximize the<br />
production of food as recommended by government<br />
health consumption standards.<br />
82<br />
* The total area of cropland, and area under particular crops, reported in this chapter is<br />
estim<strong>at</strong>ed from remotesensed imagery th<strong>at</strong> excludes area under p<strong>at</strong>hways, trails, fallow<br />
lands, and other areas of farms th<strong>at</strong> are not planted. As such the crop acreage reported<br />
in this chapter varies from th<strong>at</strong> reported by the US Census of Agriculture (which we use<br />
in Chapter 2). We believe th<strong>at</strong> using this remotesensed d<strong>at</strong>a, which may have its own<br />
shortcomings and errors, provides a conserv<strong>at</strong>ive estim<strong>at</strong>e of selfreliance. Additional<br />
methodological details are provided in Chapter 2.<br />
Figure 7.1 – Current Use of Cropland in Erie County<br />
by Food Product<br />
(Map: Authors. D<strong>at</strong>a Source: USDA, NRCS. Cropland D<strong>at</strong>a Layer, 2011.<br />
USDA, NRCS of Erie County, New York, Common Land Unit, 2011.<br />
Erie County Department of Environment and Planning, Parcel D<strong>at</strong>a, 2011 )