

ROOM AT THE TABLE - Intersight - University at Buffalo
ROOM AT THE TABLE - Intersight - University at Buffalo
ROOM AT THE TABLE - Intersight - University at Buffalo

Create successful ePaper yourself
Turn your PDF publications into a flip-book with our unique Google optimized e-Paper software.
I. Farm Expenditures<br />
In 2007, the average production expenses were $78,618 per farm.<br />
Aggreg<strong>at</strong>e expenses for all farms totaled $95.52 million in 2007. The four<br />
c<strong>at</strong>egories where farmers spent the most were, respectively, (1) hired labor,<br />
(2) animal feed, (3) supplies and maintenance repair, and (4) depreci<strong>at</strong>ion of<br />
assets (See Table 2.5).<br />
Erie County farmers spend the most on hired and contract labor. A<br />
hired worker is closer to a fulltime employee, versus a contract worker th<strong>at</strong><br />
may only work on a seasonal or project basis. Hired workers are used more<br />
frequently by Erie County farmers, and farmers spend 15 times more on<br />
hired than contract labor in 2007. The number of farms with “hired labor”<br />
has decreased since 1997, yet there were still increases in expense amounts<br />
for hired labor. For example, the combined total of contract and hired labor<br />
since 1997 has grown by 38 percent to a total of $18.65 million in 2007.<br />
There are 277 farms (23%) th<strong>at</strong> use hired labor, 37 percent fewer farms<br />
than the 441 farms in 1997. Furthermore, 60 percent of hired workers are<br />
employed for 150 days or less during a given year (See Table 2.5).<br />
Contract labor, as measured by the amount of dollars expended, has<br />
grown by $822 million since 1997. In 2007, Erie County farmers spent over<br />
$1.14 million, higher than $319,000 spent by farmers in 1997. The st<strong>at</strong>e<br />
average during the same time frame grew by more than 46 percent to a total<br />
of $18 million in 2007. Likewise, the number of farms utilizing migrant<br />
laborers jumped from 18 to 31 farms (over 72%) during the period from<br />
20022007.<br />
30<br />
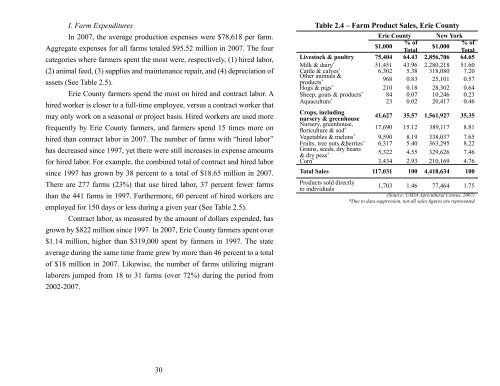
Table 2.4 – Farm Product Sales, Erie County<br />
Erie County New York<br />
$1,000<br />
% of<br />
Total<br />
$1,000<br />
% of<br />
Total<br />
Livestock & poultry 75,404 64.43 2,856,706 64.65<br />
Milk & dairy * C<strong>at</strong>tle & calves<br />
51,451 43.96 2,280,218 51.60<br />
* Other animals &<br />
products<br />
6,302 5.38 318,080 7.20<br />
* Hogs & pigs<br />
968 0.83 25,101 0.57<br />
* 210 0.18 28,302 0.64<br />
Sheep, go<strong>at</strong>s & products * 84 0.07 10,246 0.23<br />
Aquaculture * 23 0.02 20,417 0.46<br />
Crops, including<br />
nursery & greenhouse<br />
Nursery, greenhouse,<br />
F"+,!%3/%+'(c($"1<br />
41,627 35.57 1,561,927 35.35<br />
* 17,690 15.12 389,117 8.81<br />
Vegetables & melons * 9,590 8.19 338,037 7.65<br />
Fruits, tree nuts &berries * Grains, seeds, dry beans<br />
& dry peas<br />
6,317 5.40 363,295 8.22<br />
* Corn<br />
5,322 4.55 329,626 7.46<br />
* 3,434 2.93 210,169 4.76<br />
Total Sales 117,031 100 4,418,634 100<br />
Products sold directly<br />
to individuals<br />
1,703 1.46 77,464 1.75<br />
(Source: USDA Agricultural Census, 2007)<br />
!"#$%&'%()&)%*#++,$**-'./%.'&%)00%*)0$*%12#,$*%),$%,$+,$*$.&$(