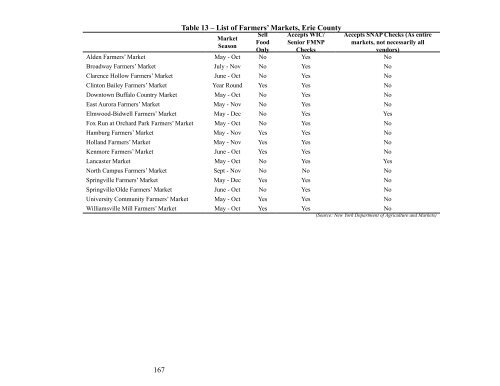
167 Table 13 – List of Farmers’ Markets, Erie County Market Season Sell Food Only Accepts WIC/ Senior FMNP Checks Accepts SNAP Checks (As entire markets, not necessarily all vendors) Alden Farmers’ Market May Oct No Yes No Broadway Farmers’ Market July Nov No Yes No Clarence Hollow Farmers’ Market June Oct No Yes No Clinton Bailey Farmers’ Market Year Round Yes Yes No Downtown <strong>Buffalo</strong> Country Market May Oct No Yes No East Aurora Farmers’ Market May Nov No Yes No ElmwoodBidwell Farmers’ Market May Dec No Yes Yes Fox Run <strong>at</strong> Orchard Park Farmers’ Market May Oct No Yes No Hamburg Farmers’ Market May Nov Yes Yes No Holland Farmers’ Market May Nov Yes Yes No Kenmore Farmers’ Market June Oct Yes Yes No Lancaster Market May Oct No Yes Yes North Campus Farmers’ Market Sept Nov No No No Springville Farmers’ Market May Dec Yes Yes No Springville/Olde Farmers’ Market June Oct No Yes No <strong>University</strong> Community Farmers’ Market May Oct Yes Yes No Williamsville Mill Farmers’ Market May Oct Yes Yes No (Source: New York Department of Agriculture and Markets)
Table 14 – Economic Characteristics of Food System, Erie County Industry Employment $1,000 Output % Sales in Food System % Sales in Erie County Production Oilseed farming 53 1,861 0.02 0.00 Grain farming 199 4,830 0.05 0.01 Vegetable & melon farming 130 12,505 0.13 0.02 Fruit farming 66 6,205 0.06 0.01 Tree nut farming 6 320 0.00 0.00 h+''#4"%$'E(#%+$'+5E(F"+,!%3/%+' 260 16,757 0.17 0.02 Other crop farming 6 453 0.00 0.00 C<strong>at</strong>tle ranching and farming 36 2,335 0.02 0.00 Dairy c<strong>at</strong>tle and milk 538 38,131 0.39 0.05 Poultry & egg 7 2,235 0.02 0.00 Other animal production 120 2,959 0.03 0.00 Production Total 1,420.67 88,591 0.90 0.12 Processing Wholesale trade 19,959 3,435,958 34.74 4.81 Flour milling and malt mnfg. 593 745,132 7.53 1.04 Confectionery mnfg from purchased chocol<strong>at</strong>e 494 160,126 1.62 0.22 Nonchocol<strong>at</strong>e confectionery mnfg. 125 43,579 0.44 0.06 Frozen food mnfg. 88 28,438 0.29 0.04 Fruit & vegetable canning, pickling, drying 62 32,402 0.33 0.05 Fluid milk & butter mnfg. 867 650,000 6.57 0.91 Cheese mnfg. 451 439,531 4.44 0.61 Dry, condensed, evapor<strong>at</strong>ed dairy product mnfg. 8 8,990 0.09 0.01 Ice cream & frozen dessert mnfg. 324 135,733 1.37 0.19 Animal slaughtering, rendering, processing (except poultry) 1,198 550,459 5.56 0.77 Bread & bakery mnfg. 488 71,991 0.73 0.10 Cookie, cracker, pasta mnfg. 187 75,898 0.77 0.11 Snack food mnfg. 9 5,373 0.05 0.01 Coffee and tea mnfg. 31 19,546 0.20 0.03 Flavoring syrup & concentr<strong>at</strong>e mnfg. 81 132,162 1.34 0.18 Seasoning & dressing mnfg. 38 18,869 0.19 0.03 Other food mnfg. 15 4,309 0.04 0.01 Soft drink & ice mnfg. 445 310,542 3.14 0.43 Breweries 71 40,155 0.41 0.06 Wineries 11 3,044 0.03 0.00 Processing Total 25,547 6,912,237 69.88 9.67 Distribution Food & beverage 13,121 587,467 5.94 0.82 Gasoline st<strong>at</strong>ions 1,660 78,178 0.79 0.11 Direct & electronic sales 3,916 218,288 2.21 0.31 Food services & drinking places 36,422 1,955,276 19.77 2.73 Distribution Total 55,120 2,839,209 28.70 3.97 Disposal W<strong>at</strong>er, sewage, other tre<strong>at</strong>ment, delivery systems 2 236 0.00 0.00 Fertilizer mnfg. 32 51,420 0.52 0.07 Disposal Total 34 51,657 0.52 0.07 Processing & Distribution Total Total Food System Total Erie County 168 80,667 82,121 512,894 9,751,446 98.58 13.64 9,891,693 100 13.83 71,507,136 100 (Source: IMPLAN, Erie County 2009)
- Page 1 and 2:
ROOM AT THE TABLE Food System Asses
- Page 3 and 4:
2 ACKNOWLEDGEMENTS Darren Kempne
- Page 5 and 6:
List of Tables 1.1 Family & Nonfa
- Page 7 and 8:
Eating is an agricultural act, writ
- Page 9 and 10:
8 Introduction
- Page 11 and 12:
0#1($&033E(B%23,!(0#1(B+,*0/'E(/40/
- Page 13 and 14:
Assessment of Current Conditions
- Page 15 and 16:
the county’s urban area. The ates
- Page 17 and 18:
health and social services” secto
- Page 19 and 20:
FOOD AFFORDABILITY Food is not even
- Page 21 and 22:
C#(N+,'(7"%#/5E(OC7(40$(2''#("B'+0/
- Page 23 and 24:
22 Clinton Bailey Farmers’ Market
- Page 25 and 26:
time period (See Table 2.1). The st
- Page 27 and 28:
soil fertility. 7 Over 48 percent o
- Page 29 and 30:
percentage has stayed near or above
- Page 31 and 32:
I. Farm Expenditures In 2007, the a
- Page 33 and 34:
32 PROCESSING AND WHOLESALE - 3 - P
- Page 35 and 36:
and oil seed crushers, were constru
- Page 37 and 38:
food manufacturing—constituted le
- Page 39 and 40:
40/( /4'( ."33"H,#-( !"#1,/,"#$( 0+
- Page 41 and 42:
40 DISTRIBUTION - 4 - Distribution
- Page 43 and 44:
generally purchase food individuall
- Page 45 and 46:
Convenience stores and gas stations
- Page 47 and 48:
more alarming, 21 of the total (46.
- Page 49 and 50:
In 2007, there were 8,662 retail es
- Page 51 and 52:
of these factors, variations exist
- Page 53 and 54:
unwanted prepared and perishable fo
- Page 55 and 56:
DISPOSAL 54 - 5 - Disposal Foodre
- Page 57 and 58:
these private businesses, including
- Page 59 and 60:
energy. Traditional methods include
- Page 61 and 62:
of food processing facilities, manu
- Page 63 and 64:
V0+I'/$(/"(+'*,'H(0#5($/0/'(0-'#!5(
- Page 65 and 66:
further state environmental plans,
- Page 67 and 68:
organizations for their preservatio
- Page 69 and 70:
conducted in a manner which is not
- Page 71 and 72:
+0#$.'+(/4'(B+0!/,!'$(0#1(2'#')/$("
- Page 73 and 74:
a contract with American Farmland T
- Page 75 and 76:
".(,#!"&'E(/4'(!"#F%'#!'(".(/4'$'(.
- Page 77 and 78:
funds directed towards planning, la
- Page 79 and 80:
that met the Greenprint Plan object
- Page 81 and 82:
Analysis
- Page 83 and 84:
a certain type of food, divided by
- Page 85 and 86:
land, clearly beyond the existing a
- Page 87 and 88:
86 - 8 - Economic Viability of Agri
- Page 89 and 90:
ECONOMIC IMPACT OF VARIOUS FOOD IND
- Page 91 and 92:
SCENARIO 1: INCREASED DEMAND FOR HE
- Page 93 and 94:
Synthesis
- Page 95 and 96:
Consumption Production Processing &
- Page 97 and 98:
Local Growing Capacity Analysis Eco
- Page 99 and 100:
STRENGTHS ($ Strong farming traditi
- Page 101 and 102:
OPPORTUNITIES ($ Access to urban an
- Page 103 and 104:
A. Fiscal Incentive Policies 7"%#/,
- Page 105 and 106:
prevent “leapfrog” development.
- Page 107 and 108:
structures serving as disincentives
- Page 109 and 110:
processes with which they may not b
- Page 111 and 112:
Each recommendation is linked to a
- Page 113 and 114:
seed banks have a positive economic
- Page 115 and 116:
$5$/'&(/"($40+'(,#."+&0/,"#(/"(&0I'
- Page 117 and 118: County, one of the requirements sho
- Page 119 and 120: 8( DUa( B+"-+0&( H"%31( "..'+( 0( )
- Page 121 and 122: +'F'!/'1( ,#( 9",#/( V'&"+0#1%&$( "
- Page 123 and 124: Investigating possible federal a
- Page 125 and 126: First, the Legislature should autho
- Page 127 and 128: foods carry the advantage of being
- Page 129 and 130: No. Recommendation 1 Sponsor Agricu
- Page 131 and 132: Appendix A - Methodology This secti
- Page 133 and 134: 2007 Nonemployer Statistics are org
- Page 135 and 136: E. Estimating Poultry Production Fo
- Page 137 and 138: Appendix B - Glossary of Terms !" A
- Page 139 and 140: opposed to the use of such methods
- Page 141 and 142: www.ersusda.gov/foodatlas. 43. “F
- Page 143 and 144: 35. NY AGM, Art 25AA, § 305(e).
- Page 145 and 146: Appendix D - Bibliography A Albrigh
- Page 147 and 148: December 2, 2011. URL: http://www.b
- Page 149 and 150: Stern, Gloria. 1975. How to Start Y
- Page 151 and 152: Appendix E - Resources 1. List of E
- Page 153 and 154: iv. D4'(OMl(S0#1(7"#$'+*0#!5(,$(J0(
- Page 155 and 156: AGRICULTURE!SURVEY!!!"!!!ERIE!COUNT
- Page 157 and 158: 156
- Page 159 and 160: 158
- Page 161 and 162: III. Eligibility Requirements for N
- Page 163 and 164: Table 2 - Weekly Food Cost per Pers
- Page 165 and 166: Table 7 - Residence Within 10 Minut
- Page 167: Table 10 - Food Service Retailing C
- Page 171 and 172: All other food manufacturing 1.00 0