

3. FOOD ChEMISTRy & bIOTEChNOLOGy 3.1. Lectures
3. FOOD ChEMISTRy & bIOTEChNOLOGy 3.1. Lectures
3. FOOD ChEMISTRy & bIOTEChNOLOGy 3.1. Lectures

Create successful ePaper yourself
Turn your PDF publications into a flip-book with our unique Google optimized e-Paper software.
Chem. Listy, 102, s265–s1311 (2008) Food Chemistry & Biotechnology<br />
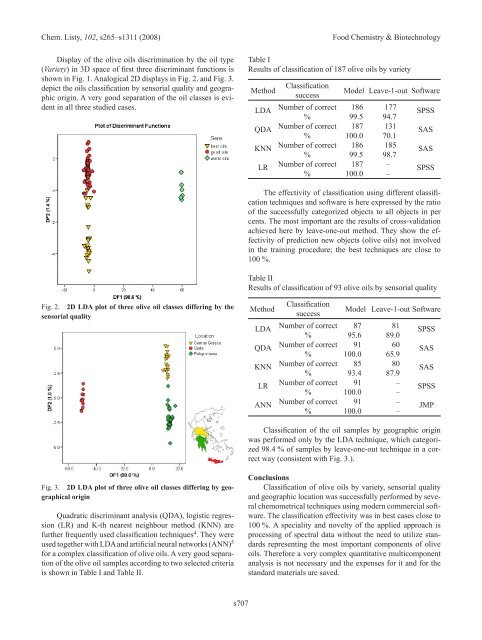
Display of the olive oils discrimination by the oil type<br />
(Variety) in 3D space of first three discriminant functions is<br />
shown in Fig. 1. Analogical 2D displays in Fig. 2. and Fig. <strong>3.</strong><br />
depict the oils classification by sensorial quality and geographic<br />
origin. A very good separation of the oil classes is evident<br />
in all three studied cases.<br />
Fig. 2. 2D LDA plot of three olive oil classes differing by the<br />
sensorial quality<br />
Fig. <strong>3.</strong> 2D LDA plot of three olive oil classes differing by geographical<br />
origin<br />
Quadratic discriminant analysis (QDA), logistic regression<br />
(LR) and K-th nearest neighbour method (Knn) are<br />
further frequently used classification techniques 4 . They were<br />
used together with LDA and artificial neural networks (Ann) 5<br />
for a complex classification of olive oils. A very good separation<br />
of the olive oil samples according to two selected criteria<br />
is shown in Table I and Table II.<br />
s707<br />
Table I<br />
Results of classification of 187 olive oils by variety<br />
Method Classification Model Leave-1-out Software<br />
success<br />
LDA<br />
number of correct<br />
%<br />
186<br />
99.5<br />
177<br />
94.7<br />
QDA<br />
number of correct<br />
%<br />
187<br />
100.0<br />
131<br />
70.1<br />
Knn<br />
number of correct<br />
%<br />
186<br />
99.5<br />
185<br />
98.7<br />
LR<br />
number of correct<br />
%<br />
187<br />
100.0<br />
–<br />
–<br />
SPSS<br />
SAS<br />
SAS<br />
SPSS<br />
The effectivity of classification using different classification<br />
techniques and software is here expressed by the ratio<br />
of the successfully categorized objects to all objects in per<br />
cents. The most important are the results of cross-validation<br />
achieved here by leave-one-out method. They show the effectivity<br />
of prediction new objects (olive oils) not involved<br />
in the training procedure; the best techniques are close to<br />
100 %.<br />
Table II<br />
Results of classification of 93 olive oils by sensorial quality<br />
Method Classification Model Leave-1-out Software<br />
success<br />
LDA<br />
number of correct<br />
%<br />
87<br />
95.6<br />
81<br />
89.0<br />
QDA<br />
number of correct<br />
%<br />
91<br />
100.0<br />
60<br />
65.9<br />
Knn<br />
number of correct<br />
%<br />
85<br />
9<strong>3.</strong>4<br />
80<br />
87.9<br />
LR<br />
number of correct<br />
%<br />
91<br />
100.0<br />
–<br />
–<br />
Ann<br />
number of correct<br />
%<br />
91<br />
100.0<br />
–<br />
–<br />
SPSS<br />
SAS<br />
SAS<br />
SPSS<br />
JMP<br />
Classification of the oil samples by geographic origin<br />
was performed only by the LDA technique, which categorized<br />
98.4 % of samples by leave-one-out technique in a correct<br />
way (consistent with Fig. <strong>3.</strong>).<br />
Conclusions<br />
Classification of olive oils by variety, sensorial quality<br />
and geographic location was successfully performed by several<br />
chemometrical techniques using modern commercial software.<br />
The classification effectivity was in best cases close to<br />
100 %. A speciality and novelty of the applied approach is<br />
processing of spectral data without the need to utilize standards<br />
representing the most important components of olive<br />
oils. Therefore a very complex quantitative multicomponent<br />
analysis is not necessary and the expenses for it and for the<br />
standard materials are saved.


