3. FOOD ChEMISTRy & bIOTEChNOLOGy 3.1. Lectures
3. FOOD ChEMISTRy & bIOTEChNOLOGy 3.1. Lectures
3. FOOD ChEMISTRy & bIOTEChNOLOGy 3.1. Lectures
You also want an ePaper? Increase the reach of your titles
YUMPU automatically turns print PDFs into web optimized ePapers that Google loves.
Chem. Listy, 102, s265–s1311 (2008) Food Chemistry & Biotechnology<br />
Table I<br />
Sample preparation and GC-HT TOF MS instrumental set-up<br />
Instrumental<br />
set-up<br />
Pesticides<br />
(baby food)<br />
PCBs<br />
(fat)<br />
Analytes group<br />
PBDEs<br />
(sewage water)<br />
Pharmaceuticals<br />
(river sediment)<br />
Sample<br />
preparation<br />
Ethyl acetate extraction<br />
of baby food followed<br />
by HPGPC clean-up.<br />
Soxhlet extraction of<br />
adipose tissue using<br />
Filtration of water followed<br />
by microextraction in<br />
Hexane:acetone (1 : 1,<br />
v : v) extraction followed<br />
6<br />
hexane:dichlormethane<br />
(1 : 1, v : v) followed by<br />
packed siringe<br />
(MEPS, C-18).<br />
by SPE clean-up.9<br />
8<br />
HPGPC clean-up. 7<br />
Injection: splitless 1 µl,<br />
250 °C<br />
Injection: pulse splitless Injection: PTV, 10 µl, Injection: pulse splitless<br />
1 µl, 250 °C, 1.5 min 50 °C (2 min) 400 °C min–1 GC<br />
Column: forte BPX-5<br />
(40 m × 0.18 mm ×<br />
0.18 μm) Temperature<br />
programming: 70 °C<br />
(1 min), 45 °C min –1<br />
to 300 °C (3 min)<br />
at 50 p.s.i.<br />
Column: forte BPX-5<br />
(30 m × 0.25 mm ×<br />
0.25 µm) Temperature<br />
programming: 80 °C<br />
to 300 °C<br />
Column: DB-XLB<br />
(15 m × 0.25 mm ×<br />
0.1 µm) Temperature<br />
programming: 80 °C<br />
1 µl, 250 °C, 2 min<br />
at 90 p.s.i.<br />
Column: forte BPX-5<br />
(30 m × 0.25 mm ×<br />
0.25 µm) Temperature<br />
programming: 80 °C<br />
(1.5 min) 45° C min–1 (2 min) 50 °C min –1 (2 min) 55 °C min –1<br />
Column flow: 1 ml min –1 to 340 °C (6 min)<br />
Column flow: 1 ml min<br />
to 320 °C (4 min) to 330 °C (5 min)<br />
–1 Column flow: 1.5 ml min –1 Column flow: 2 ml min –1<br />
TOF MS<br />
Detector voltage: 1,750 V<br />
Time of analysis: 10 min<br />
Detector voltage: 1,875 V<br />
Time of analysis: 14 min<br />
Detector voltage: 1,800 V<br />
Time of analysis: 11 min<br />
Detector voltage: 1,875 V<br />
Time of analysis: 12 min<br />
For optimization and validation purposes blank matrix<br />
(pork fat, apple based baby food) was chosen. Sewage water<br />
was obtained from local water treatment facility (Prague) and<br />
sediment was sampled at Podoli site (river Vltava).<br />
S a m p l e A n a l y s i s<br />
Different sample preparation procedures for each analytes<br />
group were applied. 6–9 Their brief overwiev can found<br />
in Table I. The GC-HT TOF MS system consisted of a HP<br />
6890 (Agilent Technologies, Palo Alto, CA, USA) gas chromatograph<br />
with split-splitless injector (or Agilent PTV Inlet)<br />
and LECO TruTOF HT time-of-flight mass spectrometer<br />
(LECO, St Joseph, MI, USA). The detector operated in<br />
electron impact ionisation mode (EI) or positive chemical<br />
ionization mode (CI+). GC-TOF MS was performed using<br />
set-up and conditions summarized also in Table I.<br />
Results<br />
F a s t A n a l y s i s a n d S p e c t r a l<br />
D e c o n v o l u t i o n<br />
To demonstrate the application potential of TruTOF<br />
HT system and ChromaTOF software for detection/identification,<br />
selected contaminats and residues were analyzed<br />
under optimized conditions shown in previous chapter. All of<br />
the analyzed sample has been processed by automated peak<br />
finding and deconvolution function. Within peak finding,<br />
the Chroma TOF software automatically detects peaks at<br />
all acquired single masses (m/z 35–650 in our work) above<br />
certain signal-to-noise level (S/n = 25 was used in the given<br />
cases). After that, deconvolution alghoritm mathematically<br />
separates mass spectra of chromatographically coeluted compounds.<br />
Deconvoluted spectra are then compared to nIST<br />
s565<br />
library and the identification is performed automatically. As<br />
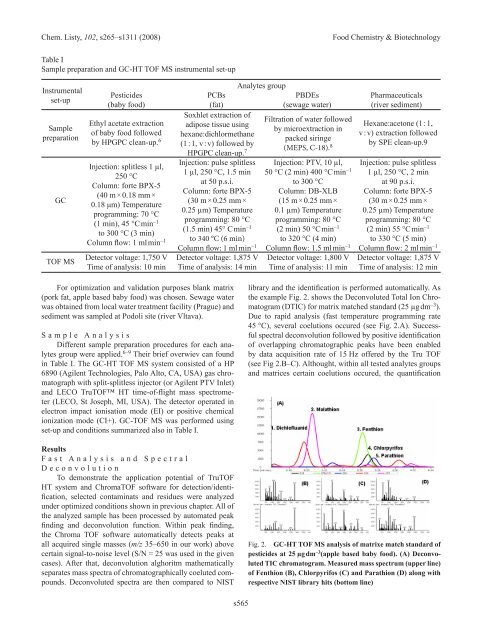
the example Fig. 2. shows the Deconvoluted Total Ion Chromatogram<br />
(DTIC) for matrix matched standard (25 µg dm –3 ).<br />
Due to rapid analysis (fast temperature programming rate<br />
45 °C), several coelutions occured (see Fig. 2.A). Successful<br />
spectral deconvolution followed by positive identification<br />
of overlapping chromatographic peaks have been enabled<br />
by data acquisition rate of 15 Hz offered by the Tru TOF<br />
(see Fig 2.B–C). Althought, within all tested analytes groups<br />
and matrices certain coelutions occured, the quantification<br />
Fig. 2. GC-hT TOF MS analysis of matrixe match standard of<br />
pesticides at 25 µg dm –3 (apple based baby food). (A) Deconvoluted<br />
TIC chromatogram. Measured mass spectrum (upper line)<br />
of Fenthion (b), Chlorpyrifos (C) and Parathion (D) along with<br />
respective NIST library hits (bottom line)


