- Page 1 and 2:
LINEAR ALGEBRA Jim Hefferon Fourth
- Page 3 and 4:
Preface This book helps students to
- Page 5 and 6:
Advice. This book’s emphasis on m
- Page 7 and 8:
Contents Chapter One: Linear System
- Page 9:
III Laplace’s Formula ...........
- Page 12 and 13:
2 Chapter One. Linear Systems must
- Page 14 and 15:
4 Chapter One. Linear Systems 1.5 T
- Page 16 and 17:
6 Chapter One. Linear Systems 1.9 E
- Page 18 and 19:
8 Chapter One. Linear Systems 1.14
- Page 20 and 21:
10 Chapter One. Linear Systems ̌ 1
- Page 22 and 23:
12 Chapter One. Linear Systems 1.33
- Page 24 and 25:
14 Chapter One. Linear Systems free
- Page 26 and 27:
16 Chapter One. Linear Systems abov
- Page 28 and 29:
18 Chapter One. Linear Systems We w
- Page 30 and 31:
20 Chapter One. Linear Systems We
- Page 32 and 33:
22 Chapter One. Linear Systems reve
- Page 34 and 35:
24 Chapter One. Linear Systems 3.1
- Page 36 and 37:
26 Chapter One. Linear Systems eche
- Page 38 and 39:
28 Chapter One. Linear Systems To f
- Page 40 and 41:
30 Chapter One. Linear Systems Proo
- Page 42 and 43:
32 Chapter One. Linear Systems than
- Page 44 and 45:
34 Chapter One. Linear Systems (a)
- Page 46 and 47:
36 Chapter One. Linear Systems to f
- Page 48 and 49:
38 Chapter One. Linear Systems The
- Page 50 and 51:
40 Chapter One. Linear Systems line
- Page 52 and 53:
42 Chapter One. Linear Systems ̌ 1
- Page 54 and 55:
44 Chapter One. Linear Systems Note
- Page 56 and 57:
46 Chapter One. Linear Systems 2.7
- Page 58 and 59:
48 Chapter One. Linear Systems 2.23
- Page 60 and 61:
50 Chapter One. Linear Systems III
- Page 62 and 63:
52 Chapter One. Linear Systems elem
- Page 64 and 65:
54 Chapter One. Linear Systems One
- Page 66 and 67:
56 Chapter One. Linear Systems III.
- Page 68 and 69:
58 Chapter One. Linear Systems We n
- Page 70 and 71:
60 Chapter One. Linear Systems and
- Page 72 and 73:
62 Chapter One. Linear Systems 2.8
- Page 74 and 75:
64 Chapter One. Linear Systems 2.26
- Page 76 and 77:
66 Chapter One. Linear Systems [0,0
- Page 78 and 79:
68 Chapter One. Linear Systems Now
- Page 80 and 81:
70 Chapter One. Linear Systems (b)
- Page 82 and 83:
Topic Accuracy of Computations Gaus
- Page 84 and 85:
74 Chapter One. Linear Systems The
- Page 86 and 87:
Topic Analyzing Networks The diagra
- Page 88 and 89:
78 Chapter One. Linear Systems and
- Page 90 and 91:
80 Chapter One. Linear Systems (c)
- Page 93 and 94:
Chapter Two Vector Spaces The first
- Page 95 and 96:
Section I. Definition of Vector Spa
- Page 97 and 98:
Section I. Definition of Vector Spa
- Page 99 and 100:
Section I. Definition of Vector Spa
- Page 101 and 102:
Section I. Definition of Vector Spa
- Page 103 and 104:
Section I. Definition of Vector Spa
- Page 105 and 106:
Section I. Definition of Vector Spa
- Page 107 and 108:
Section I. Definition of Vector Spa
- Page 109 and 110:
Section I. Definition of Vector Spa
- Page 111 and 112:
Section I. Definition of Vector Spa
- Page 113 and 114:
Section I. Definition of Vector Spa
- Page 115 and 116:
Section I. Definition of Vector Spa
- Page 117 and 118:
Section I. Definition of Vector Spa
- Page 119 and 120:
Section II. Linear Independence 109
- Page 121 and 122:
Section II. Linear Independence 111
- Page 123 and 124:
Section II. Linear Independence 113
- Page 125 and 126:
Section II. Linear Independence 115
- Page 127 and 128:
Section II. Linear Independence 117
- Page 129 and 130:
Section II. Linear Independence 119
- Page 131 and 132:
Section III. Basis and Dimension 12
- Page 133 and 134:
Section III. Basis and Dimension 12
- Page 135 and 136:
Section III. Basis and Dimension 12
- Page 137 and 138:
Section III. Basis and Dimension 12
- Page 139 and 140:
Section III. Basis and Dimension 12
- Page 141 and 142:
Section III. Basis and Dimension 13
- Page 143 and 144:
Section III. Basis and Dimension 13
- Page 145 and 146:
Section III. Basis and Dimension 13
- Page 147 and 148:
Section III. Basis and Dimension 13
- Page 149 and 150:
Section III. Basis and Dimension 13
- Page 151 and 152:
Section III. Basis and Dimension 14
- Page 153 and 154:
Section III. Basis and Dimension 14
- Page 155 and 156:
Section III. Basis and Dimension 14
- Page 157 and 158:
Section III. Basis and Dimension 14
- Page 159 and 160:
Section III. Basis and Dimension 14
- Page 161 and 162:
Section III. Basis and Dimension 15
- Page 163 and 164:
Topic Fields Computations involving
- Page 165 and 166:
Topic Crystals Everyone has noticed
- Page 167 and 168:
Topic: Crystals 157 is a good basis
- Page 169 and 170:
Topic Voting Paradoxes Imagine that
- Page 171 and 172:
Topic: Voting Paradoxes 161 subspac
- Page 173 and 174:
Topic: Voting Paradoxes 163 between
- Page 175 and 176:
Topic Dimensional Analysis “You c
- Page 177 and 178:
Topic: Dimensional Analysis 167 for
- Page 179 and 180:
Topic: Dimensional Analysis 169 whi
- Page 181 and 182:
Topic: Dimensional Analysis 171 (b)
- Page 183 and 184:
Chapter Three Maps Between Spaces I
- Page 185 and 186:
Section I. Isomorphisms 175 and sca
- Page 187 and 188:
Section I. Isomorphisms 177 The fir
- Page 189 and 190:
Section I. Isomorphisms 179 picture
- Page 191 and 192:
Section I. Isomorphisms 181 (b) f:
- Page 193 and 194:
Section I. Isomorphisms 183 (d) Pro
- Page 195 and 196:
Section I. Isomorphisms 185 2.3 The
- Page 197 and 198:
Section I. Isomorphisms 187 In the
- Page 199 and 200:
Section I. Isomorphisms 189 Associa
- Page 201 and 202:
Section II. Homomorphisms 191 II Ho
- Page 203 and 204:
Section II. Homomorphisms 193 So on
- Page 205 and 206:
Section II. Homomorphisms 195 1.12
- Page 207 and 208:
Section II. Homomorphisms 197 1.21
- Page 209 and 210:
Section II. Homomorphisms 199 1.40
- Page 211 and 212:
Section II. Homomorphisms 201 Recal
- Page 213 and 214:
Section II. Homomorphisms 203 Now,
- Page 215 and 216:
Section II. Homomorphisms 205 2.12
- Page 217 and 218:
Section II. Homomorphisms 207 Exerc
- Page 219 and 220:
Section II. Homomorphisms 209 (a) h
- Page 221 and 222:
Section II. Homomorphisms 211 2.45
- Page 223 and 224:
Section III. Computing Linear Maps
- Page 225 and 226:
Section III. Computing Linear Maps
- Page 227 and 228:
Section III. Computing Linear Maps
- Page 229 and 230:
Section III. Computing Linear Maps
- Page 231 and 232:
Section III. Computing Linear Maps
- Page 233 and 234:
Section III. Computing Linear Maps
- Page 235 and 236:
Section III. Computing Linear Maps
- Page 237 and 238:
Section III. Computing Linear Maps
- Page 239 and 240:
Section III. Computing Linear Maps
- Page 241 and 242:
Section III. Computing Linear Maps
- Page 243 and 244:
Section IV. Matrix Operations 233 1
- Page 245 and 246:
Section IV. Matrix Operations 235 (
- Page 247 and 248:
Section IV. Matrix Operations 237 D
- Page 249 and 250:
Section IV. Matrix Operations 239 A
- Page 251 and 252:
Section IV. Matrix Operations 241 e
- Page 253 and 254:
Section IV. Matrix Operations 243 2
- Page 255 and 256:
Section IV. Matrix Operations 245 T
- Page 257 and 258:
Section IV. Matrix Operations 247 a
- Page 259 and 260: Section IV. Matrix Operations 249 3
- Page 261 and 262: Section IV. Matrix Operations 251 a
- Page 263 and 264: Section IV. Matrix Operations 253 R
- Page 265 and 266: Section IV. Matrix Operations 255 W
- Page 267 and 268: Section IV. Matrix Operations 257 4
- Page 269 and 270: Section IV. Matrix Operations 259 4
- Page 271 and 272: Section IV. Matrix Operations 261 4
- Page 273 and 274: Section V. Change of Basis 263 1.2
- Page 275 and 276: Section V. Change of Basis 265 to t
- Page 277 and 278: Section V. Change of Basis 267 ̌ 1
- Page 279 and 280: Section V. Change of Basis 269 for
- Page 281 and 282: Section V. Change of Basis 271 beca
- Page 283 and 284: Section V. Change of Basis 273 Exer
- Page 285 and 286: Section VI. Projection 275 VI Proje
- Page 287 and 288: Section VI. Projection 277 1.4 Exam
- Page 289 and 290: Section VI. Projection 279 (a) ( 1
- Page 291 and 292: Section VI. Projection 281 For the
- Page 293 and 294: Section VI. Projection 283 By the f
- Page 295 and 296: Section VI. Projection 285 (c) Let
- Page 297 and 298: Section VI. Projection 287 We will
- Page 299 and 300: Section VI. Projection 289 of the v
- Page 301 and 302: Section VI. Projection 291 is perpe
- Page 303 and 304: Section VI. Projection 293 3.19 Wha
- Page 305 and 306: Topic Line of Best Fit This Topic r
- Page 307 and 308: Topic: Line of Best Fit 297 the sam
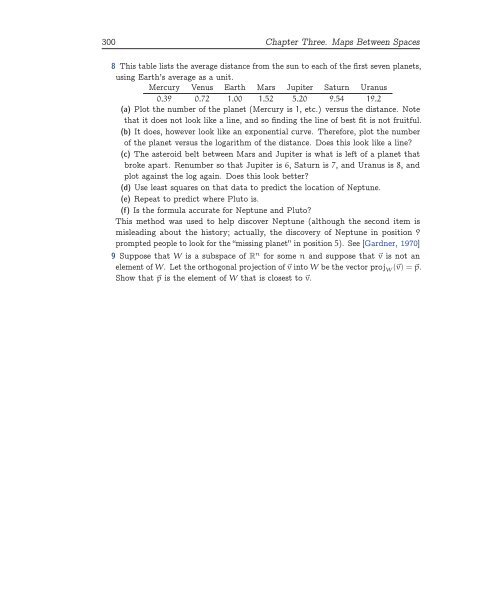
- Page 309: Topic: Line of Best Fit 299 4 Find
- Page 313 and 314: Topic: Geometry of Linear Maps 303
- Page 315 and 316: Topic: Geometry of Linear Maps 305
- Page 317 and 318: Topic: Geometry of Linear Maps 307
- Page 319 and 320: Topic: Magic Squares 309 One interp
- Page 321 and 322: Topic: Magic Squares 311 1 2 3 4 5
- Page 323 and 324: Topic Markov Chains Here is a simpl
- Page 325 and 326: Topic: Markov Chains 315 a middle c
- Page 327 and 328: Topic: Markov Chains 317 3 [Kelton]
- Page 329 and 330: Topic Orthonormal Matrices In The E
- Page 331 and 332: Topic: Orthonormal Matrices 321 (we
- Page 333 and 334: Topic: Orthonormal Matrices 323 ( a
- Page 335 and 336: Chapter Four Determinants In the fi
- Page 337 and 338: Section I. Definition 327 A good st
- Page 339 and 340: Section I. Definition 329 the opera
- Page 341 and 342: Section I. Definition 331 is the ve
- Page 343 and 344: Section I. Definition 333 A singula
- Page 345 and 346: Section I. Definition 335 could pos
- Page 347 and 348: Section I. Definition 337 I.3 The P
- Page 349 and 350: Section I. Definition 339 Now this
- Page 351 and 352: Section I. Definition 341 matrix, k
- Page 353 and 354: Section I. Definition 343 Computing
- Page 355 and 356: Section I. Definition 345 3.34 A ma
- Page 357 and 358: Section I. Definition 347 could be
- Page 359 and 360: Section I. Definition 349 Thus, in
- Page 361 and 362:
Section I. Definition 351 That is,
- Page 363 and 364:
Section I. Definition 353 in the to
- Page 365 and 366:
Section II. Geometry of Determinant
- Page 367 and 368:
Section II. Geometry of Determinant
- Page 369 and 370:
Section II. Geometry of Determinant
- Page 371 and 372:
Section II. Geometry of Determinant
- Page 373 and 374:
Section III. Laplace’s Formula 36
- Page 375 and 376:
Section III. Laplace’s Formula 36
- Page 377 and 378:
Section III. Laplace’s Formula 36
- Page 379 and 380:
Topic Cramer’s Rule A linear syst
- Page 381 and 382:
Topic: Cramer’s Rule 371 x − y
- Page 383 and 384:
Topic: Speed of Calculating Determi
- Page 385 and 386:
Topic: Speed of Calculating Determi
- Page 387 and 388:
Topic: Chiò’s Method 377 This re
- Page 389 and 390:
Topic: Chiò’s Method 379 (a) 2 1
- Page 391 and 392:
Topic: Projective Geometry 381 This
- Page 393 and 394:
Topic: Projective Geometry 383 Ther
- Page 395 and 396:
Topic: Projective Geometry 385 (We
- Page 397 and 398:
Topic: Projective Geometry 387 the
- Page 399 and 400:
Topic: Projective Geometry 389 The
- Page 401 and 402:
Topic: Projective Geometry 391 Exer
- Page 403 and 404:
Topic: Computer Graphics 393 In thi
- Page 405 and 406:
Topic: Computer Graphics 395 In thi
- Page 407 and 408:
Chapter Five Similarity We have sho
- Page 409 and 410:
Section I. Complex Vector Spaces 39
- Page 411 and 412:
Section I. Complex Vector Spaces 40
- Page 413 and 414:
Section II. Similarity 403 represen
- Page 415 and 416:
Section II. Similarity 405 A common
- Page 417 and 418:
Section II. Similarity 407 ̌ 1.13
- Page 419 and 420:
Section II. Similarity 409 2.4 Lemm
- Page 421 and 422:
Section II. Similarity 411 Exercise
- Page 423 and 424:
Section II. Similarity 413 where x
- Page 425 and 426:
Section II. Similarity 415 We next
- Page 427 and 428:
Section II. Similarity 417 3.12 Def
- Page 429 and 430:
Section II. Similarity 419 3.18 The
- Page 431 and 432:
Section II. Similarity 421 a criter
- Page 433 and 434:
Section II. Similarity 423 3.46 Dia
- Page 435 and 436:
Section III. Nilpotence 425 has thi
- Page 437 and 438:
Section III. Nilpotence 427 1.7 Exa
- Page 439 and 440:
Section III. Nilpotence 429 2.2 Cor
- Page 441 and 442:
Section III. Nilpotence 431 2.9 Exa
- Page 443 and 444:
Section III. Nilpotence 433 But, th
- Page 445 and 446:
Section III. Nilpotence 435 (In the
- Page 447 and 448:
Section III. Nilpotence 437 2.19 Ex
- Page 449 and 450:
Section III. Nilpotence 439 ̌ 2.24
- Page 451 and 452:
Section IV. Jordan Form 441 The pol
- Page 453 and 454:
Section IV. Jordan Form 443 Proof W
- Page 455 and 456:
Section IV. Jordan Form 445 We refe
- Page 457 and 458:
Section IV. Jordan Form 447 (a) (e)
- Page 459 and 460:
Section IV. Jordan Form 449 Convers
- Page 461 and 462:
Section IV. Jordan Form 451 and to
- Page 463 and 464:
Section IV. Jordan Form 453 The dia
- Page 465 and 466:
Section IV. Jordan Form 455 The rig
- Page 467 and 468:
Section IV. Jordan Form 457 2.12 Ex
- Page 469 and 470:
Section IV. Jordan Form 459 So the
- Page 471 and 472:
Section IV. Jordan Form 461 Therefo
- Page 473 and 474:
Section IV. Jordan Form 463 2.38 In
- Page 475 and 476:
Topic: Method of Powers 465 ⃗v T
- Page 477 and 478:
Topic: Method of Powers 467 39368 -
- Page 479 and 480:
Topic: Stable Populations 469 Now i
- Page 481 and 482:
Topic: Page Ranking 471 importance
- Page 483 and 484:
Topic: Page Ranking 473 Exercises 1
- Page 485 and 486:
Topic: Linear Recurrences 475 Write
- Page 487 and 488:
Topic: Linear Recurrences 477 We ca
- Page 489 and 490:
Topic: Linear Recurrences 479 place
- Page 491 and 492:
Topic: Linear Recurrences 481 After
- Page 493 and 494:
Topic: Coupled Oscillators 483 We s
- Page 495 and 496:
Topic: Coupled Oscillators 485 we a
- Page 497 and 498:
Appendix Mathematics is made of arg
- Page 499 and 500:
A-3 hypothesis. This argument is wr
- Page 501 and 502:
A-5 Another example is this proof t
- Page 503 and 504:
A-7 A collection that is like a set
- Page 505 and 506:
A-9 A function has a left inverse i
- Page 507:
A-11 related to 102. Verifying the
- Page 510 and 511:
[Am. Math. Mon., Dec. 1966] Hans Li
- Page 512 and 513:
[Gardner, 1970] Martin Gardner, Mat
- Page 514 and 515:
[Online Encyclopedia of Integer Seq
- Page 516 and 517:
Index accuracy of Gauss’s Method,
- Page 518 and 519:
elementary reduction operations, 5
- Page 520 and 521:
linear independence multiset, 113 l
- Page 522 and 523:
in projective plane, 383, 392 polyn
- Page 524 and 525:
summation notation, for permutation