Prospects of Colloidal Nanocrystals for Electronic - Computer Science
Prospects of Colloidal Nanocrystals for Electronic - Computer Science
Prospects of Colloidal Nanocrystals for Electronic - Computer Science

You also want an ePaper? Increase the reach of your titles
YUMPU automatically turns print PDFs into web optimized ePapers that Google loves.
424 Chemical Reviews, 2010, Vol. 110, No. 1 Talapin et al.<br />
Photoconductive gain is determined by the ratio between<br />
the free carrier lifetime (τ) and transit time (Tt):<br />
G i ) τ<br />
T t<br />
Gi is a very important parameter, which is determined by<br />
the number <strong>of</strong> electrons flowing through the external circuit<br />
per each absorbed photon or, in other words, the number <strong>of</strong><br />
cycles the majority carriers can make be<strong>for</strong>e recombining.<br />
Gi e 1 represents the case <strong>of</strong> a primary photoconductor.<br />
Gi > 1 indicates the presence <strong>of</strong> the secondary photoconductivity,<br />
when more carries flow through the circuit than<br />
the number <strong>of</strong> photons absorbed per unit time. Photoconductive<br />
gain can be efficiently controlled by adjusting both τ<br />
and Tt. The <strong>for</strong>mer is mainly controlled by engineering<br />
trapping states, whereas the latter is determined by device<br />
design and electronic properties <strong>of</strong> material. In the presence<br />
<strong>of</strong> long-living traps, the carrier lifetime is effectively<br />
prolonged, and the majority carriers can cycle in the circuit<br />
until they recombine with trapped carriers. The secondary<br />
photocurrent, induced by traps, can in principle last <strong>for</strong> hours<br />
and days; its duration is determined by the release rate <strong>of</strong><br />
minority carriers from the trap states. This situation typically<br />
results in a slow decay <strong>of</strong> the photocurrent after illumination<br />
turn <strong>of</strong>f.<br />
Equation 38 demonstrates the main trade-<strong>of</strong>f <strong>for</strong> photoconductive<br />
detectors. If the fast response is the goal, the<br />
carrier lifetime must be short. This leads to a low gain and<br />
lower sensitivity. On the other hand, very sensitive photoconductors<br />
are slow and have a long response time. With<br />
respect to the NC photodetectors, this situation will be<br />
illustrated in the following sections. Gi can generally take<br />
values from much less than unity to the upper limit <strong>of</strong> ∼106 given by the restrictions imposed by the charge-limited<br />
current flow, impact ionization, and dielectric breakdown. 434<br />
Lifetime τ can range from 10-13 s to many seconds<br />
depending on the particular material. For example, in highly<br />
sensitive photodetectors based on PbS NC solids, τ was<br />
reported to lie in the millisecond-to-second time scale, and<br />
Gi was estimated to be about 102-104 . 265,435 Transit time Tt<br />
depends on the device length <strong>of</strong> conducting channel L,<br />
electric field E, and carrier mobility µ:<br />
T t ) L<br />
µE<br />
Taking into account eq 37, E ) V/L (where V is applied<br />
voltage), and Nλ ) Pin/hν, we can express the photocurrent<br />
as:<br />
iph ) ηe( Pin hν)( µτV<br />
L<br />
(38)<br />
(39)<br />
Noise. The main noise sources in photoconductors are<br />
Johnson noise, generation-recombination, and 1/f noise. The<br />
Johnson noise ij originates from the fluctuations induced by<br />
the thermal motion <strong>of</strong> the charge carriers, which causes the<br />
fluctuating charge gradients. It is expressed through the noiseequivalent<br />
bandwidth ∆f and detector resistance R as shown<br />
by eq 41:<br />
i j ) � 4kT∆f<br />
R<br />
2 )<br />
(40)<br />
(41)<br />
Johnson noise is independent <strong>of</strong> the applied bias; all other<br />
kinds <strong>of</strong> noise are bias dependent. Generation-recombination<br />
noise igr originates from the statistical fluctuations in the<br />
generation and recombination rates <strong>of</strong> nonequilibrium charge<br />
carriers. 1/f noise is given by:<br />
i 1/f ) � i2 ∆f<br />
f<br />
where f is the electrical frequency, ∆f is the electrical<br />
bandwidth, and i is the dc current. The 1/f noise is affected<br />
by the nonohmic contancts and surface traps. There<strong>for</strong>e,<br />
reduction <strong>of</strong> 1/f noise is rather an experimental art. Usually,<br />
1/f noise is significant at low modulation frequencies, while<br />
at higher frequencies its amplitude drops below that <strong>of</strong><br />
Johnson noise or generation-recombination noise.<br />
7.2.3. Photoconductivity Measurements<br />
(42)<br />
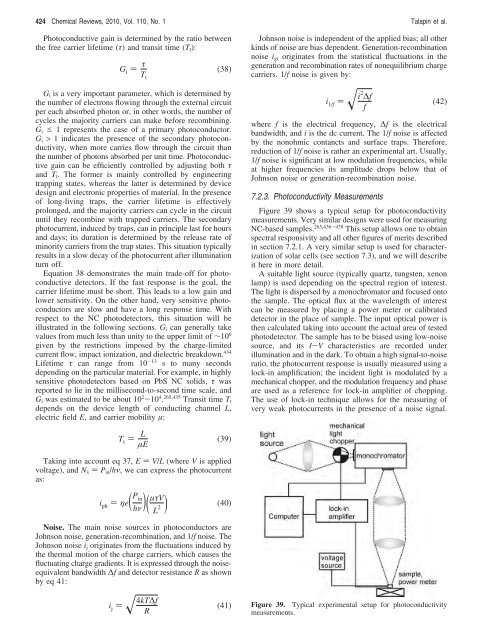
Figure 39 shows a typical setup <strong>for</strong> photoconductivity<br />
measurements. Very similar designs were used <strong>for</strong> measuring<br />
NC-based samples. 265,436-438 This setup allows one to obtain<br />
spectral responsivity and all other figures <strong>of</strong> merits described<br />
in section 7.2.1. A very similar setup is used <strong>for</strong> characterization<br />
<strong>of</strong> solar cells (see section 7.3), and we will describe<br />
it here in more detail.<br />
A suitable light source (typically quartz, tungsten, xenon<br />
lamp) is used depending on the spectral region <strong>of</strong> interest.<br />
The light is dispersed by a monochromator and focused onto<br />
the sample. The optical flux at the wavelength <strong>of</strong> interest<br />
can be measured by placing a power meter or calibrated<br />
detector in the place <strong>of</strong> sample. The input optical power is<br />
then calculated taking into account the actual area <strong>of</strong> tested<br />
photodetector. The sample has to be biased using low-noise<br />
source, and its I-V characteristics are recorded under<br />
illumination and in the dark. To obtain a high signal-to-noise<br />
ratio, the photocurrent response is usually measured using a<br />
lock-in amplification; the incident light is modulated by a<br />
mechanical chopper, and the modulation frequency and phase<br />
are used as a reference <strong>for</strong> lock-in amplifier <strong>of</strong> chopping.<br />
The use <strong>of</strong> lock-in technique allows <strong>for</strong> the measuring <strong>of</strong><br />
very weak photocurrents in the presence <strong>of</strong> a noise signal.<br />
Figure 39. Typical experimental setup <strong>for</strong> photoconductivity<br />
measurements.