University of Sunderland - Travel Plan Final 200510-1
University of Sunderland - Travel Plan Final 200510-1
University of Sunderland - Travel Plan Final 200510-1

You also want an ePaper? Increase the reach of your titles
YUMPU automatically turns print PDFs into web optimized ePapers that Google loves.
<strong>University</strong> <strong>of</strong> <strong>Sunderland</strong> <strong>Travel</strong> <strong>Plan</strong> Update<br />
Time<br />
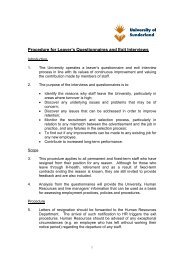
0 to 15 minutes<br />
16 to 30 minutes<br />
31 to 45 minutes<br />
46 to 60 minutes<br />
Over 60 minutes<br />
Total<br />
3.2.1.5 Study Patterns<br />
Study Days<br />
5087709/<strong>University</strong> <strong>of</strong> <strong>Sunderland</strong> - <strong>Travel</strong> <strong>Plan</strong> <strong>Final</strong> <strong>200510</strong>.docx<br />
97<br />
Table 3.38 38 – 2009 Time taken to <strong>Travel</strong> to <strong>University</strong> – All Students<br />
Figure 3. .18 – 2009 Time taken to <strong>Travel</strong> to <strong>University</strong> – All Students<br />
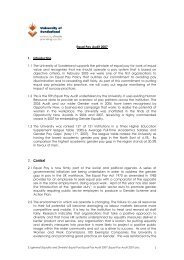
In 2009, the majority <strong>of</strong> respondents ( (52.2%) study 3-4 days a week, a decrease <strong>of</strong> 3 percentage<br />
points from 2007 (55.6%). This is shown in Table 3.39 and Figure 3.19. These results indicate that<br />
students travel to <strong>University</strong> slightly less <strong>of</strong>ten than in previous years, with more respondents (8.3<br />
percentage points) present at the <strong>University</strong> for just one or two days a week in 2009.<br />
Days<br />
35.0%<br />
30.0%<br />
25.0%<br />
20.0%<br />
15.0%<br />
10.0%<br />
5.0%<br />
0.0%<br />
0 to 15<br />
minutes<br />
Table 3.39 – 2007 and 2009 Compa Comparison <strong>of</strong> Study Days per Week – All Students<br />
2007<br />
Number <strong>of</strong><br />
Respondents<br />
1-2 days 74<br />
3-4 days 437 55.6% 551 52.2% -3.4%<br />
5 days 248 31.6% 272 25.8% -5.8%<br />
6 days 27<br />
16 to 30<br />
minutes<br />
Number <strong>of</strong> Respondents % <strong>of</strong> Respondents<br />
2007<br />
% <strong>of</strong><br />
Respondents<br />
Total 786 100% 1055 100%<br />
346<br />
370<br />
176<br />
104<br />
70<br />
1066<br />
31 to 45<br />
minutes<br />
2009<br />
Number <strong>of</strong><br />
Respondents<br />
46 to 60<br />
minutes<br />
2009<br />
% <strong>of</strong><br />
Respondents<br />
32.5%<br />
34.7%<br />
16.5%<br />
9.8%<br />
6.6%<br />
100.1%<br />
Over 60<br />
minutes<br />
% Point<br />
Variation<br />
2007-09<br />
9.4% 187 17.7% 8.3%<br />
3.4% 45 4.3% 0.9%