University of Sunderland - Travel Plan Final 200510-1
University of Sunderland - Travel Plan Final 200510-1
University of Sunderland - Travel Plan Final 200510-1

Create successful ePaper yourself
Turn your PDF publications into a flip-book with our unique Google optimized e-Paper software.
<strong>University</strong> <strong>of</strong> <strong>Sunderland</strong> <strong>Travel</strong> <strong>Plan</strong> Update<br />
60.0%<br />
50.0%<br />
40.0%<br />
30.0%<br />
20.0%<br />
10.0%<br />
0.0%<br />
Study Hours<br />
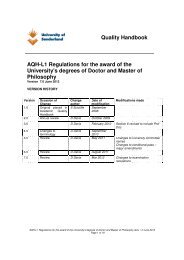
Figure 3.19 - 2007 and 2009 Comparison <strong>of</strong> Study Days per Week – All Students<br />
Students dents were asked about the time they usually start and finish at the <strong>University</strong> <strong>University</strong>. In 2007, most<br />
respondents started their study in the traditional peak hour period. This appears to have cchanged<br />
considerably by 2009, , with the majority <strong>of</strong> respondents travelling to <strong>University</strong> later in the day (as<br />
illustrated in Table 3.40). . A similar pattern emerges in the afternoon as students appear to be<br />
leaving <strong>University</strong> earlier than in previous yea years (as illustrated in Table 3.41 41).<br />
Start Time<br />
Table 3.40 40 – 2007 and 2009 Comparison <strong>of</strong> Start Times – All Students<br />
2007<br />
Number <strong>of</strong><br />
Respondents<br />
espondents<br />
By 08:00 78 14% 3<br />
08:00-08:30 136 24.3% 17<br />
08:30-09:00 275 49.2% 135<br />
09:00-09:30 29 5.2% 264<br />
09:30-10:00 12 2.1% 91<br />
10:00-12:00 20 3.6% 119<br />
After 12:00 9 1.6% 53<br />
Total 559 100% 682<br />
5087709/<strong>University</strong> <strong>of</strong> <strong>Sunderland</strong> - <strong>Travel</strong> <strong>Plan</strong> <strong>Final</strong> <strong>200510</strong>.docx<br />
98<br />
1-2 2 days 3-4 days 5 days 6 days<br />
2007 % <strong>of</strong><br />
Respondents<br />
2009<br />
Number <strong>of</strong><br />
Respondents<br />
2009 % <strong>of</strong><br />
Respondents<br />
% Point<br />
Variation<br />
2007-09<br />
0.4% -13.6%<br />
2.5% -21.8%<br />
19.8% -29.4%<br />
38.7% 33.5%<br />
13.3% 11.2%<br />
17.4% 13.8%<br />
7.8% 6.2%<br />
99.9%<br />
2007<br />
2009