Noncontact Atomic Force Microscopy - Yale School of Engineering ...
Noncontact Atomic Force Microscopy - Yale School of Engineering ...
Noncontact Atomic Force Microscopy - Yale School of Engineering ...

You also want an ePaper? Increase the reach of your titles
YUMPU automatically turns print PDFs into web optimized ePapers that Google loves.
Short and medium range electrostatic forces analyzed by<br />
Kelvin probe force microscopy<br />
Th. Glatzel, S. Kawai, S. Koch, A. Barat<strong>of</strong>f, and E. Meyer<br />
Department <strong>of</strong> Physics, University <strong>of</strong> Basel, 4056 Basel, Switzerland.<br />
Tu-1510<br />
We discuss the influences <strong>of</strong> short and medium range electrostatic forces on the local<br />
contact potential difference (LCPD) by means <strong>of</strong> amplitude modulated Kelvin probe<br />
force microscopy (AM-KPFM) measured on single crystal KBr(100) surfaces. Bias- and<br />
z-spectroscopic curves at atomic scale showing clear features related to the influence <strong>of</strong><br />
the short range electrostatic interaction [1].<br />
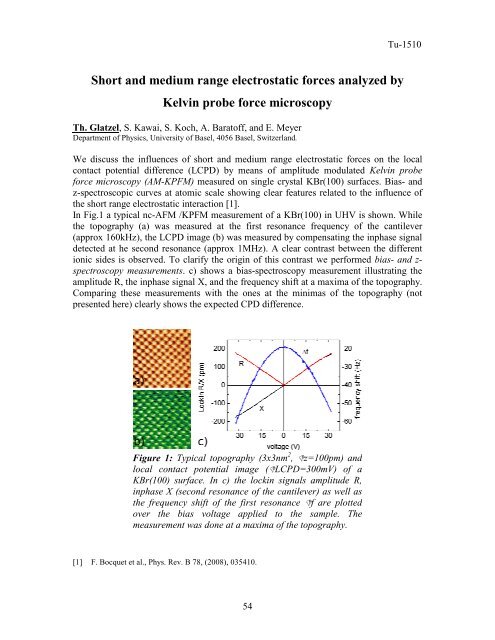
In Fig.1 a typical nc-AFM /KPFM measurement <strong>of</strong> a KBr(100) in UHV is shown. While<br />
the topography (a) was measured at the first resonance frequency <strong>of</strong> the cantilever<br />
(approx 160kHz), the LCPD image (b) was measured by compensating the inphase signal<br />
detected at he second resonance (approx 1MHz). A clear contrast between the different<br />
ionic sides is observed. To clarify the origin <strong>of</strong> this contrast we performed bias- and zspectroscopy<br />
measurements. c) shows a bias-spectroscopy measurement illustrating the<br />
amplitude R, the inphase signal X, and the frequency shift at a maxima <strong>of</strong> the topography.<br />
Comparing these measurements with the ones at the minimas <strong>of</strong> the topography (not<br />
presented here) clearly shows the expected CPD difference.<br />
Figure 1: Typical topography (3x3nm 2 , �z=100pm) and<br />
local contact potential image (�LCPD=300mV) <strong>of</strong> a<br />
KBr(100) surface. In c) the lockin signals amplitude R,<br />
inphase X (second resonance <strong>of</strong> the cantilever) as well as<br />
the frequency shift <strong>of</strong> the first resonance �f are plotted<br />
over the bias voltage applied to the sample. The<br />
measurement was done at a maxima <strong>of</strong> the topography.<br />
[1] F. Bocquet et al., Phys. Rev. B 78, (2008), 035410.<br />
54