Noncontact Atomic Force Microscopy - Yale School of Engineering ...
Noncontact Atomic Force Microscopy - Yale School of Engineering ...
Noncontact Atomic Force Microscopy - Yale School of Engineering ...

Create successful ePaper yourself
Turn your PDF publications into a flip-book with our unique Google optimized e-Paper software.
Th-1020<br />
Adhesion-induced energy dissipation and atom-tracked tip changes<br />
S. Kawai, Th. Glatzel, S. Koch, B. Such, A. Barat<strong>of</strong>f, and E. Meyer<br />
Department <strong>of</strong> Physics, University <strong>of</strong> Basel, Klingelbergstr. 82, 4056 Basel Switzerland<br />
We have simultaneously measured the frequency shift Δf and the interaction-induced<br />
dissipated energy per cycle Ets above a maximum in a topographic image <strong>of</strong> KBr(001).<br />
The measurements were performed at room temperature in UHV using the 2nd flexural<br />
mode <strong>of</strong> a silicon cantilever (1039369 Hz) at 11 constant amplitudes A between 12.8 and<br />
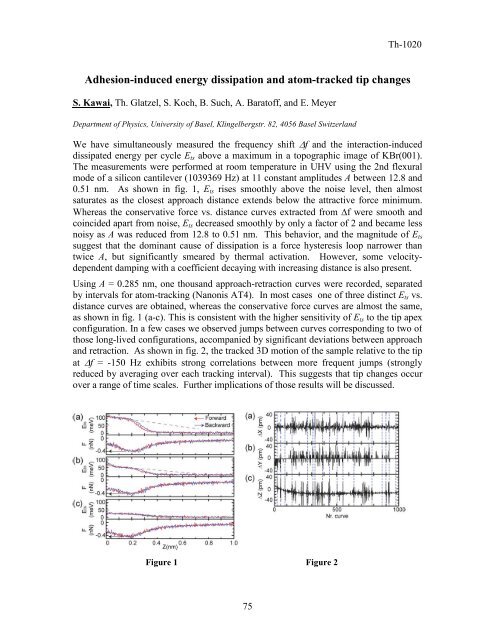
0.51 nm. As shown in fig. 1, Ets rises smoothly above the noise level, then almost<br />
saturates as the closest approach distance extends below the attractive force minimum.<br />
Whereas the conservative force vs. distance curves extracted from Δf were smooth and<br />
coincided apart from noise, Ets decreased smoothly by only a factor <strong>of</strong> 2 and became less<br />
noisy as A was reduced from 12.8 to 0.51 nm. This behavior, and the magnitude <strong>of</strong> Ets<br />
suggest that the dominant cause <strong>of</strong> dissipation is a force hysteresis loop narrower than<br />
twice A, but significantly smeared by thermal activation. However, some velocitydependent<br />
damping with a coefficient decaying with increasing distance is also present.<br />
Using A = 0.285 nm, one thousand approach-retraction curves were recorded, separated<br />
by intervals for atom-tracking (Nanonis AT4). In most cases one <strong>of</strong> three distinct Ets vs.<br />
distance curves are obtained, whereas the conservative force curves are almost the same,<br />
as shown in fig. 1 (a-c). This is consistent with the higher sensitivity <strong>of</strong> Ets to the tip apex<br />
configuration. In a few cases we observed jumps between curves corresponding to two <strong>of</strong><br />
those long-lived configurations, accompanied by significant deviations between approach<br />
and retraction. As shown in fig. 2, the tracked 3D motion <strong>of</strong> the sample relative to the tip<br />
at Δf = -150 Hz exhibits strong correlations between more frequent jumps (strongly<br />
reduced by averaging over each tracking interval). This suggests that tip changes occur<br />
over a range <strong>of</strong> time scales. Further implications <strong>of</strong> those results will be discussed.<br />
Figure 1 Figure 2<br />
75