PONTIFICIA UNIVERSIDAD CATÓLICA DE CHILE DEPARTAMENTO SALUD PÚBLICA / FACULTAD DE MEDICINA F. DATOS SOBRE LA O LAS AYUDAS TÉCNICAS RECIBIDAS. Con el objetivo <strong>de</strong> analizar las <strong>Ayudas</strong> <strong>Técnicas</strong> recibidas, se empleó la clasificación tomada <strong>de</strong>l informe Final <strong>de</strong> Evaluación <strong>de</strong> <strong>Ayudas</strong> técnicas <strong>de</strong>l Fondo Nacional <strong>de</strong> Discapacidad, <strong>20</strong>08. El Grupo 6 fue agregado por los investigadores a cargo <strong>de</strong>l presente estudio para agregar AT que no correspondían a ninguno <strong>de</strong> los anteriores grupos. Clasificación <strong>de</strong> los tipos <strong>de</strong> ayudas técnicas Grupo 1 Sillas <strong>de</strong> ruedas, bastones, andadores, colchón cojín antiescaras, burrito, mesa cajón, barras paralelas, catre clínico, columpio, vestibulador, colchoneta, rollo, cuña, balón, cono, parador, tabla prona, tabla supina. Grupo 2 Audífonos, equipos FM, elementos <strong>de</strong> baja visión, elementos para ciegos, implante coclear. Grupo 3 Órtesis, prótesis, zapatos ortopédicos, plantillas ortopédicas, cuello ortopédico, canaletas, férula atlanta, cojín abductor, corsé, co<strong>de</strong>ras, órtesis tobillo−pie (OTP). Grupo 4 Endoprótesis <strong>de</strong> ca<strong>de</strong>ra, rodilla, columna, hombro y kit alargador <strong>de</strong> extremida<strong>de</strong>s. Grupo 5 Aditamientos que favorece la autonomía en las activida<strong>de</strong>s <strong>de</strong> la vida diaria (por ejemplo elementos adaptados para la alimentación, vestuario, higiene, salas <strong>de</strong> clases, puestos <strong>de</strong> trabajo), rampla, máquina perkins. Grupo 6 No clasificables por investigadores en alguno <strong>de</strong> los anteriores 5 grupos: tubos <strong>de</strong> oxígeno, BIPAP pe<strong>de</strong>stal, sillón rojo, sittings (sin especificar su función), motor <strong>de</strong> aspiración. Fuente: <strong>Informe</strong> Final <strong>de</strong> Evaluación programa <strong>de</strong> <strong>Ayudas</strong> <strong>Técnicas</strong>, Fondo Nacional <strong>de</strong> la Discapacidad, <strong>20</strong>08. – Pregunta N°30: Enumere y <strong>de</strong>scriba por separado todas las ayudas técnicas que el niño/a ha recibido. La Tabla 7 resume el número <strong>de</strong> niños/as que han recibido ayudas técnicas, según los grupos <strong>de</strong>scritos anteriormente. La mayoría <strong>de</strong> las ayudas técnicas entregadas correspon<strong>de</strong>n al grupo N°1, seguido por el grupo N°2 y luego los grupos N°3 y N°4. 60
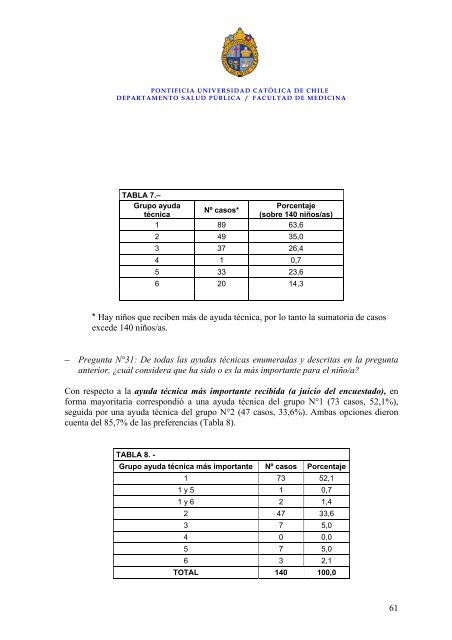
PONTIFICIA UNIVERSIDAD CATÓLICA DE CHILE DEPARTAMENTO SALUD PÚBLICA / FACULTAD DE MEDICINA TABLA 7.– Grupo ayuda técnica Nº casos* Porcentaje (<strong>sobre</strong> 140 niños/as) 1 89 63,6 2 49 35,0 3 37 26,4 4 1 0,7 5 33 23,6 6 <strong>20</strong> 14,3 * Hay niños que reciben más <strong>de</strong> ayuda técnica, por lo tanto la sumatoria <strong>de</strong> casos exce<strong>de</strong> 140 niños/as. – Pregunta N°31: De todas las ayudas técnicas enumeradas y <strong>de</strong>scritas en la pregunta anterior, ¿cuál consi<strong>de</strong>ra que ha sido o es la más importante para el niño/a? Con respecto a la ayuda técnica más importante recibida (a juicio <strong>de</strong>l encuestado), en forma mayoritaria correspondió a una ayuda técnica <strong>de</strong>l grupo N°1 (73 casos, 52,1%), seguida por una ayuda técnica <strong>de</strong>l grupo N°2 (47 casos, 33,6%). Ambas opciones dieron cuenta <strong>de</strong>l 85,7% <strong>de</strong> las preferencias (Tabla 8). TABLA 8. - Grupo ayuda técnica más importante Nº casos Porcentaje 1 73 52,1 1 y 5 1 0,7 1 y 6 2 1,4 2 47 33,6 3 7 5,0 4 0 0,0 5 7 5,0 6 3 2,1 TOTAL 140 100,0 61