1 (US Patent No. US D560281 (S1); US D5601344 (S1); US ...
1 (US Patent No. US D560281 (S1); US D5601344 (S1); US ...
1 (US Patent No. US D560281 (S1); US D5601344 (S1); US ...
You also want an ePaper? Increase the reach of your titles
YUMPU automatically turns print PDFs into web optimized ePapers that Google loves.
EXPECTED VALUES<br />
The positivity rate for each laboratory will be dependent on several factors including the method of specimen collection, the<br />
handling and transportation of the specimen, the time of year, and the prevalence of influenza A or B at the time of testing.<br />
<strong>US</strong> influenza A rates (as reported by the <strong>US</strong> Centers for Disease Control) during the 2006-7 period of TRU FLU clinical trials<br />
ranged from 4% in the months of October/<strong>No</strong>vember 2006 to a peak of 40% in February 2007. The influenza B positivity<br />
rate peaked at approximately 8% during March/April 2007. The influenza A positivity rates at the clinical trial sites (based on<br />
tissue culture) averaged 14% in the month of February and 10% in March. Influenza B rates varied from 11% to 18% during<br />
the same time. The prevalence of Influenza A and B antigens in individuals showing signs and symptoms, as determined by<br />
the TRU FLU Assay is summarized in Table 1.<br />
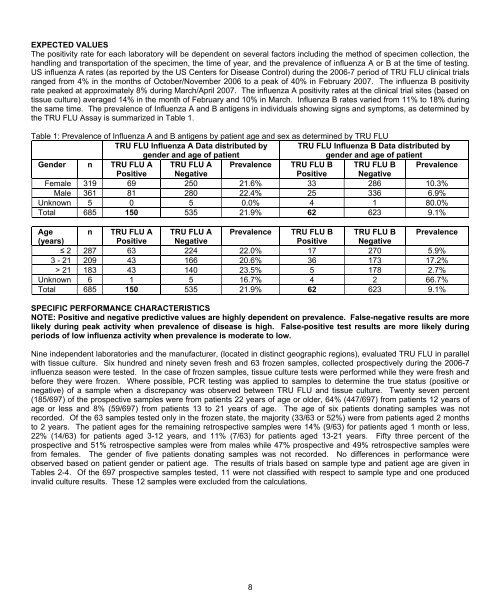
Table 1: Prevalence of Influenza A and B antigens by patient age and sex as determined by TRU FLU<br />
TRU FLU Influenza A Data distributed by TRU FLU Influenza B Data distributed by<br />
gender and age of patient<br />
gender and age of patient<br />
Gender n TRU FLU A TRU FLU A Prevalence TRU FLU B TRU FLU B Prevalence<br />
Positive Negative<br />
Positive Negative<br />
Female 319 69 250 21.6% 33 286 10.3%<br />
Male 361 81 280 22.4% 25 336 6.9%<br />
Unknown 5 0 5 0.0% 4 1 80.0%<br />
Total 685 150 535 21.9% 62 623 9.1%<br />
Age n TRU FLU A TRU FLU A Prevalence TRU FLU B TRU FLU B Prevalence<br />
(years)<br />
Positive Negative<br />
Positive Negative<br />
≤ 2 287 63 224 22.0% 17 270 5.9%<br />
3 - 21 209 43 166 20.6% 36 173 17.2%<br />
> 21 183 43 140 23.5% 5 178 2.7%<br />
Unknown 6 1 5 16.7% 4 2 66.7%<br />
Total 685 150 535 21.9% 62 623 9.1%<br />
SPECIFIC PERFORMANCE CHARACTERISTICS<br />
NOTE: Positive and negative predictive values are highly dependent on prevalence. False-negative results are more<br />
likely during peak activity when prevalence of disease is high. False-positive test results are more likely during<br />
periods of low influenza activity when prevalence is moderate to low.<br />
Nine independent laboratories and the manufacturer, (located in distinct geographic regions), evaluated TRU FLU in parallel<br />
with tissue culture. Six hundred and ninety seven fresh and 63 frozen samples, collected prospectively during the 2006-7<br />
influenza season were tested. In the case of frozen samples, tissue culture tests were performed while they were fresh and<br />
before they were frozen. Where possible, PCR testing was applied to samples to determine the true status (positive or<br />
negative) of a sample when a discrepancy was observed between TRU FLU and tissue culture. Twenty seven percent<br />
(185/697) of the prospective samples were from patients 22 years of age or older, 64% (447/697) from patients 12 years of<br />
age or less and 8% (59/697) from patients 13 to 21 years of age. The age of six patients donating samples was not<br />
recorded. Of the 63 samples tested only in the frozen state, the majority (33/63 or 52%) were from patients aged 2 months<br />
to 2 years. The patient ages for the remaining retrospective samples were 14% (9/63) for patients aged 1 month or less,<br />
22% (14/63) for patients aged 3-12 years, and 11% (7/63) for patients aged 13-21 years. Fifty three percent of the<br />
prospective and 51% retrospective samples were from males while 47% prospective and 49% retrospective samples were<br />
from females. The gender of five patients donating samples was not recorded. <strong>No</strong> differences in performance were<br />
observed based on patient gender or patient age. The results of trials based on sample type and patient age are given in<br />
Tables 2-4. Of the 697 prospective samples tested, 11 were not classified with respect to sample type and one produced<br />
invalid culture results. These 12 samples were excluded from the calculations.<br />
8


