
Create successful ePaper yourself
Turn your PDF publications into a flip-book with our unique Google optimized e-Paper software.
teams from the day of their arrival. Dr Astrid Junge, Head<br />
of Research at F-MARC, analysed the data submitted daily<br />
by the team physicians. Thanks to intense <strong>com</strong>munication<br />
with the team physicians, a response rate of 96% was<br />
achieved. Overall, the results demonstrated the success of<br />
<strong>FIFA</strong>’s and F-MARC’s preventive efforts: the overall injury<br />
rate of 1.9 injuries per match was the lowest observed<br />
at a men’s World Cup since 1998, when injury recording<br />
started.<br />
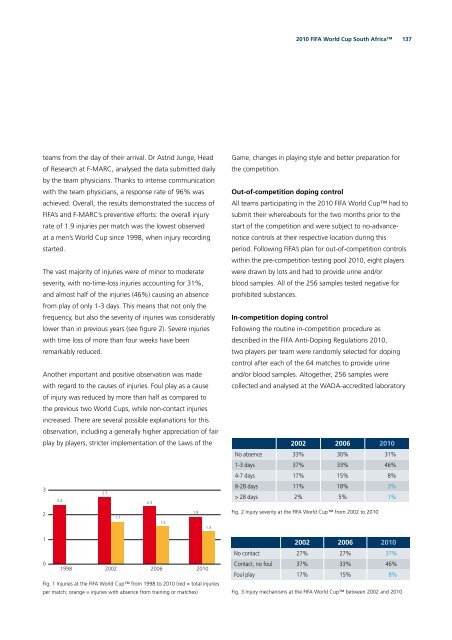
The vast majority of injuries were of minor to moderate<br />
severity, with no-time-loss injuries accounting for 31%,<br />
and almost half of the injuries (46%) causing an absence<br />
from play of only 1-3 days. This means that not only the<br />
frequency, but also the severity of injuries was considerably<br />
lower than in previous years (see fi gure 2). Severe injuries<br />
with time loss of more than four weeks have been<br />
remarkably reduced.<br />
Another important and positive observation was made<br />
with regard to the causes of injuries. Foul play as a cause<br />
of injury was reduced by more than half as <strong>com</strong>pared to<br />
the previous two World Cups, while non-contact injuries<br />
increased. There are several possible explanations for this<br />
observation, including a generally higher appreciation of fair<br />
play by players, stricter implementation of the Laws of the<br />
3<br />
2<br />
1<br />
0<br />
2.4<br />
1998<br />
2.7<br />
2002<br />
1.7<br />
2.3<br />
2006<br />
1.5<br />
1.9<br />
<strong>2010</strong><br />
Fig. 1 Injuries at the <strong>FIFA</strong> World Cup from 1998 to <strong>2010</strong> (red = total injuries<br />
per match; orange = injuries with absence from training or matches)<br />
1.3<br />
<strong>2010</strong> <strong>FIFA</strong> World Cup South Africa<br />
Game, changes in playing style and better preparation for<br />
the <strong>com</strong>petition.<br />
137<br />
Out-of-<strong>com</strong>petition doping control<br />
All teams participating in the <strong>2010</strong> <strong>FIFA</strong> World Cup had to<br />
submit their whereabouts for the two months prior to the<br />
start of the <strong>com</strong>petition and were subject to no-advancenotice<br />
controls at their respective location during this<br />
period. Following <strong>FIFA</strong>’s plan for out-of-<strong>com</strong>petition controls<br />
within the pre-<strong>com</strong>petition testing pool <strong>2010</strong>, eight players<br />
were drawn by lots and had to provide urine and/or<br />
blood samples. All of the 256 samples tested negative for<br />
prohibited substances.<br />
In-<strong>com</strong>petition doping control<br />
Following the routine in-<strong>com</strong>petition procedure as<br />
described in the <strong>FIFA</strong> Anti-Doping Regulations <strong>2010</strong>,<br />
two players per team were randomly selected for doping<br />
control after each of the 64 matches to provide urine<br />
and/or blood samples. Altogether, 256 samples were<br />
collected and analysed at the WADA-accredited laboratory<br />
2002 2006 <strong>2010</strong><br />
No absence 33% 30% 31%<br />
1-3 days 37% 33% 46%<br />
4-7 days 17% 15% 8%<br />
8-28 days 11% 18% 3%<br />
> 28 days 2% 5% 1%<br />
Fig. 2 Injury severity at the <strong>FIFA</strong> World Cup from 2002 to <strong>2010</strong><br />
2002 2006 <strong>2010</strong><br />
No contact 27% 27% 37%<br />
Contact, no foul 37% 33% 46%<br />
Foul play 17% 15% 8%<br />
Fig. 3 Injury mechanisms at the <strong>FIFA</strong> World Cup between 2002 and <strong>2010</strong>