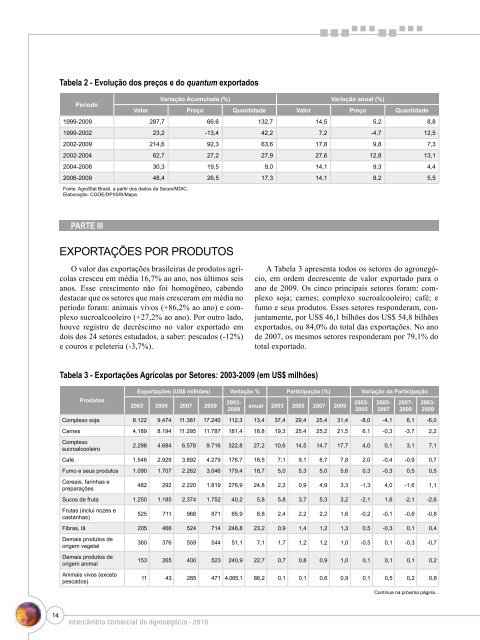
14 Tabela 2 - Evolução dos preços e do quantum exportados Período PARTE III EXPORTAÇÕES POR PRODUTOS O valor <strong>da</strong>s exportações brasileiras de produtos agrícolas cresceu em média 16,7% ao ano, nos últimos seis anos. Esse crescimento não foi homogêneo, cabendo destacar que os setores que mais cresceram em média no período foram: animais vivos (+86,2% ao ano) e complexo sucroalcooleiro (+27,2% ao ano). Por outro lado, houve registro de decréscimo no valor exportado em dois dos 24 setores estu<strong>da</strong>dos, a saber: pescados (-12%) e couros e peleteria (-3,7%). Intercâmbio Comercial do Agronegócio - 2010 Variação Acumula<strong>da</strong> (%) Variação anual (%) Valor Preço Quanti<strong>da</strong>de Valor Preço Quanti<strong>da</strong>de 1999-2009 287,7 66,6 132,7 14,5 5,2 8,8 1999-2002 23,2 -13,4 42,2 7,2 -4,7 12,5 2002-2009 214,6 92,3 63,6 17,8 9,8 7,3 2002-2004 62,7 27,2 27,9 27,6 12,8 13,1 2004-2006 30,3 19,5 9,0 14,1 9,3 4,4 2006-2009 48,4 26,5 17,3 14,1 8,2 5,5 Fonte: AgroStat Brasil, a partir dos <strong>da</strong>dos <strong>da</strong> Secex/MDIC. Elaboração: CGOE/DPI/SRI/Mapa. Tabela 3 - Exportações Agrícolas por Setores: 2003-2009 (em US$ milhões) Produtos A Tabela 3 apresenta todos os setores do agronegócio, em ordem decrescente de valor exportado para o ano de 2009. Os cinco principais setores foram: complexo soja; carnes; complexo sucroalcooleiro; café; e fumo e seus produtos. Esses setores responderam, conjuntamente, por US$ 46,1 bilhões dos US$ 54,8 bilhões exportados, ou 84,0% do total <strong>da</strong>s exportações. No ano de 2007, os mesmos setores responderam por 79,1% do total exportado. Exportações (US$ milhões) Variação % Participação (%) Variação <strong>da</strong> Participação 2003 2005 2007 2009 2003- 2009 anual 2003 2005 2007 2009 Complexo soja 8.122 9.474 11.381 17.240 112,3 13,4 37,4 29,4 25,4 31,4 -8,0 -4,1 6,1 -6,0 Carnes 4.189 8.194 11.295 11.787 181,4 18,8 19,3 25,4 25,2 21,5 6,1 -0,3 -3,7 2,2 Complexo sucroalcooleiro 2003- 2005 2005- 2007 2007- 2009 2003- 2009 2.298 4.684 6.578 9.716 322,8 27,2 10,6 14,5 14,7 17,7 4,0 0,1 3,1 7,1 Café 1.546 2.929 3.892 4.279 176,7 18,5 7,1 9,1 8,7 7,8 2,0 -0,4 -0,9 0,7 Fumo e seus produtos 1.090 1.707 2.262 3.046 179,4 18,7 5,0 5,3 5,0 5,6 0,3 -0,3 0,5 0,5 Cereais, farinhas e preparações 482 292 2.220 1.819 276,9 24,8 2,2 0,9 4,9 3,3 -1,3 4,0 -1,6 1,1 Sucos de fruta 1.250 1.185 2.374 1.752 40,2 5,8 5,8 3,7 5,3 3,2 -2,1 1,6 -2,1 -2,6 Frutas (inclui nozes e castanhas) 525 711 968 871 65,9 8,8 2,4 2,2 2,2 1,6 -0,2 -0,1 -0,6 -0,8 Fibras, lã 205 466 524 714 248,8 23,2 0,9 1,4 1,2 1,3 0,5 -0,3 0,1 0,4 Demais produtos de origem vegetal Demais produtos de origem animal Animais vivos (exceto pescados) 360 376 559 544 51,1 7,1 1,7 1,2 1,2 1,0 -0,5 0,1 -0,3 -0,7 153 265 400 523 240,9 22,7 0,7 0,8 0,9 1,0 0,1 0,1 0,1 0,2 11 43 285 471 4.065,1 86,2 0,1 0,1 0,6 0,9 0,1 0,5 0,2 0,8 Continua na próxima página...
Continuação Produtos Produtos alimentícios diversos O principal setor exportador, o complexo soja, participou com 31,4% do valor total exportado. Em 2009, as exportações de soja em grão aumentaram de 24,5 milhões de tonela<strong>da</strong>s para 28,5 milhões de tonela<strong>da</strong>s (+16,3%), enquanto os preços tiveram recuo de 10,5% em relação a 2008. Mesmo com o declínio dos preços, o aumento do quantum exportado possibilitou elevação do valor exportado de soja em grãos no ano de 2009 (+4,3%). Convém lembrar que a cotação de 2008 foi re- INTRODUÇÃO Exportações (US$ milhões) Variação % Participação (%) Variação <strong>da</strong> Participação 2003 2005 2007 2009 2003- 2009 anual 2003 2005 2007 2009 2003- 2005 2005- 2007 2007- 2009 2003- 2009 203 293 346 411 102,5 12,5 0,9 0,9 0,8 0,7 -0,0 -0,1 -0,0 -0,2 Cacau e seus produtos 321 387 365 352 9,7 1,6 1,5 1,2 0,8 0,6 -0,3 -0,4 -0,2 -0,8 Bebi<strong>da</strong>s 148 202 252 235 58,7 8,0 0,7 0,6 0,6 0,4 -0,1 -0,1 -0,1 -0,3 Pescados 419 406 311 195 -53,6 -12,0 1,9 1,3 0,7 0,4 -0,7 -0,6 -0,3 -1,6 Chá, mate e especiarias 108 136 201 192 76,6 9,9 0,5 0,4 0,4 0,3 -0,1 0,0 -0,1 -0,2 Lácteos 56 150 299 167 195,4 19,8 0,3 0,5 0,7 0,3 0,2 0,2 -0,4 0,0 Produtos hortícolas, leguminosas, raízes e tubérculos Produtos oleaginosos (exclui soja) 48 53 102 161 237,8 22,5 0,2 0,2 0,2 0,3 -0,1 0,1 0,1 0,1 68 144 107 149 120,6 14,1 0,3 0,4 0,2 0,3 0,1 -0,2 0,0 -0,0 Rações para animais 33 61 104 103 208,4 20,6 0,2 0,2 0,2 0,2 0,0 0,0 -0,0 0,0 Produtos apícolas 53 25 26 71 33,9 5,0 0,2 0,1 0,1 0,1 -0,2 -0,0 0,1 -0,1 Plantas vivas e produtos de floricultura 21 28 35 32 47,3 6,7 0,1 0,1 0,1 0,1 -0,0 -0,0 -0,0 -0,0 Couros e peleteria 3 5 2 2 -20,0 -3,7 0,0 0,0 0,0 0,0 0,0 -0,0 -0,0 -0,0 TOTAL 21.714 32.214 44.888 54.831 152,5 16,7 100,0 100,0 100,0 100,0 - - - - Fonte: AgroStat Brasil, a partir dos <strong>da</strong>dos <strong>da</strong> Secex/MDIC. Elaboração: CGOE/DPI/SRI/Mapa. 225 200 175 150 125 100 75 50 25 Gráfico 6 - Preços de Produtos Exportados do Agronegócio 1997-2009 (1997=100) corde (US$ 446,9 a tonela<strong>da</strong> na média <strong>da</strong>s exportações brasileiras do ano) para to<strong>da</strong> a série analisa<strong>da</strong> e os preços de 2009 foram 37,7% superiores aos de 2007. O gráfico a seguir (Gráfico 6) apresenta a variação nos preços médios de exportação brasileira de alguns produtos de exportação do agronegócio, podendo-se verificar que, apesar <strong>da</strong> que<strong>da</strong> dos preços em 2009, os preços médios de ven<strong>da</strong>s no ano foram muito superiores aos <strong>da</strong> média histórica. 1997 1998 1999 2000 2001 2002 2003 2004 2005 2006 2007 2008 2009 Soja em grãos Carne bovina Carne de frango Carne suína Óleo de soja Açúcar Fonte: AgroStat Brasil, a partir dos <strong>da</strong>dos <strong>da</strong> Secex/MDIC. Elaboração: CGOE/DPI/SRI/Mapa. 15
- Page 3: Ministério da Agricultura, Pecuár
- Page 7 and 8: Sumário NotaS MetodológicaS .....
- Page 9 and 10: NOTAS METODOLÓGICAS Notas Metodol
- Page 12 and 13: 10 introdução PARTE I AGRONEGÓCI
- Page 14 and 15: 12 Em uma análise de mais longo pr
- Page 18 and 19: 16 Os bons preços em dólar não e
- Page 20 and 21: 18 Continuação Razões de Concent
- Page 22 and 23: 20 Continuação País A análise p
- Page 24 and 25: 22 UE-27 Coreia do Sul Rússia Chin
- Page 26 and 27: 24 Continuação País / Bloco Tabe
- Page 28 and 29: 26 Na Tabela 11, são apresentados
- Page 30 and 31: 28 Continuação US$ bilhões 170 1
- Page 32: Intercâmbio Comercial do Agronegó
- Page 35 and 36: PARTE I O COMÉRCIO BILATERAL BRASI
- Page 37 and 38: 600 500 400 300 200 US$ milhões Gr
- Page 39 and 40: Continuação 16% Gráfico IV - Exp
- Page 41 and 42: Tabela V - Importações do País e
- Page 43 and 44: Continuação SH 6 PRODUTO Importa
- Page 45 and 46: PARTE IV ASSUNTOS SANITÁRIOS E FIT
- Page 47 and 48: Continuação NCM 1507.90.19 - ÓLE
- Page 49 and 50: PARTE I O COMÉRCIO BILATERAL BRASI
- Page 51 and 52: US$ milhões Gráfico II - Comérci
- Page 53 and 54: Tabela V - Importações do País e
- Page 55 and 56: Continuação SH 6 PRODUTO Importa
- Page 57 and 58: Fax : +244 222 323724 Email : secre
- Page 60 and 61: 58 ARÁBIA SAuDITA Arábia Saudita:
- Page 62 and 63: 60 Tabela II - Principais Produtos
- Page 64 and 65: 62 Continuação Total: US$ 769 mil
- Page 66 and 67:
64 Tabela V - Importações do Paí
- Page 68 and 69:
66 Continuação SH 6 PRODUTO Inter
- Page 70 and 71:
68 PARTE IV ASSUNTOS SANITÁRIOS E
- Page 72 and 73:
70 ARGÉlIA Argélia: Capital: Arge
- Page 74 and 75:
72 Tabela II - Principais Produtos
- Page 76 and 77:
74 Tabela IV - Principais Produtos
- Page 78 and 79:
76 Tabela V - Importações do Paí
- Page 80 and 81:
78 QueStõeS SPS No ÂMBito Bilater
- Page 82 and 83:
80 ARGENTINA Argentina: Capital: Bu
- Page 84 and 85:
82 Continuação PRODUTO OUTROS VE
- Page 86 and 87:
84 Continuação PRODUTO Tabela IV
- Page 88 and 89:
86 Gráfico VI - Valor das Importa
- Page 90 and 91:
88 Tabela V - Importações do Paí
- Page 92 and 93:
90 Continuação SH 6 PRODUTO 19059
- Page 94 and 95:
92 PoNto de coNtato Para coNveNçã
- Page 96 and 97:
94 BANGlADESH Bangladesh: Capital:
- Page 98 and 99:
96 Tabela II - Principais Produtos
- Page 100 and 101:
98 Tabela IV - Principais Produtos
- Page 102 and 103:
100 Continuação SH 6 PRODUTO Tabe
- Page 104 and 105:
102 QueStõeS SPS No ÂMBito Bilate
- Page 106 and 107:
104 CANADÁ Canadá: Capital: Ottaw
- Page 108 and 109:
106 Tabela II - Principais Produtos
- Page 110 and 111:
108 Tabela IV - Principais Produtos
- Page 112 and 113:
110 Tabela V - Importações do Pa
- Page 114 and 115:
112 Tabela V - Importações do Pa
- Page 116 and 117:
114 Continuação SH 6 PRODUTO Inte
- Page 118 and 119:
116 Continuação SH 6 PRODUTO Inte
- Page 120 and 121:
118 PARTE IV ASSUNTOS SANITÁRIOS E
- Page 122:
120 Continuação 1201.00.90 - OUTR
- Page 125 and 126:
PARTE I O COMÉRCIO BILATERAL BRASI
- Page 127 and 128:
US$ milhões 8.000 7.000 6.000 5.00
- Page 129 and 130:
Continuação Gráfico IV - Exporta
- Page 131 and 132:
Tabela V - Importações do País e
- Page 133 and 134:
Continuação SH 6 PRODUTO 151620 2
- Page 135 and 136:
CHINA Em decorrência dos focos de
- Page 137 and 138:
Tabela VIII - Cotas Tarifárias par
- Page 139 and 140:
PARTE I O COMÉRCIO BILATERAL BRASI
- Page 141 and 142:
Tabela III - Principais Produtos Ag
- Page 143 and 144:
Gráfico IV - Exportações Agríco
- Page 145 and 146:
Continuação SH 6 PRODUTO 20712 18
- Page 147 and 148:
Continuação SH 6 PRODUTO Importa
- Page 149 and 150:
Continuação SH 6 PRODUTO Importa
- Page 151 and 152:
Continuação SH 6 PRODUTO Importa
- Page 153 and 154:
PARTE V Tabela VII - Tarifa para os
- Page 155 and 156:
PARTE I O COMÉRCIO BILATERAL BRASI
- Page 157 and 158:
Dentre os produtos agrícolas expor
- Page 159 and 160:
Total: US$ 89 milhões 4% 2% 11% 13
- Page 161 and 162:
Continuação SH 6 PRODUTO Tabela V
- Page 163 and 164:
Continuação SH 6 PRODUTO Importa
- Page 165 and 166:
Person in charge: Daniel Hector Ric
- Page 167 and 168:
PARTE I O COMÉRCIO BILATERAL BRASI
- Page 169 and 170:
Esse grande incremento nas exporta
- Page 171 and 172:
Continuação 4% Gráfico IV - Expo
- Page 173 and 174:
Tabela V - Importações do País e
- Page 175 and 176:
Tabela V - Importações do País e
- Page 177 and 178:
Continuação SH 6 PRODUTO 230120 F
- Page 179 and 180:
COREIA DO SUL PoNto de coNtato Para
- Page 181 and 182:
COREIA DO SUL Tabela VIII - Cotas T
- Page 183 and 184:
PARTE I O COMÉRCIO BILATERAL BRASI
- Page 185 and 186:
US$ milhões 900 800 700 600 500 40
- Page 187 and 188:
Gráfico IV - Exportações Agríco
- Page 189 and 190:
Continuação SH 6 PRODUTO Tabela V
- Page 191 and 192:
QueStõeS SPS No ÂMBito Bilateral
- Page 194 and 195:
192 EMIRADoS ÁRABES uNIDoS Emirado
- Page 196 and 197:
194 Na pauta de importações brasi
- Page 198 and 199:
196 Continuação PRODUTO Intercâm
- Page 200 and 201:
198 Continuação SH 6 PRODUTO 1601
- Page 202 and 203:
200 Continuação SH 6 PRODUTO 1902
- Page 204 and 205:
202 Continuação SH 6 PRODUTO 2204
- Page 206 and 207:
204 PARTE IV ASSUNTOS SANITÁRIOS E
- Page 208 and 209:
206 ESTADoS uNIDoS Washington, DC.
- Page 210 and 211:
208 Tabela II - Principais Produtos
- Page 212 and 213:
210 Tabela IV - Principais Produtos
- Page 214 and 215:
212 Tabela V - Importações do Pa
- Page 216 and 217:
214 Continuação SH 6 PRODUTO 1806
- Page 218 and 219:
216 Continuação SH 6 PRODUTO Inte
- Page 220 and 221:
218 Continuação SH 6 PRODUTO Inte
- Page 222 and 223:
220 acordoS MultilateraiS O país
- Page 224:
222 Continuação 2009.19.00 - OUTR
- Page 227 and 228:
PARTE I O COMÉRCIO BILATERAL BRASI
- Page 229 and 230:
US$ milhões Gráfico II - Comérci
- Page 231 and 232:
Total: US$ 381 milhões 1% 1% Gráf
- Page 233 and 234:
Continuação SH 6 PRODUTO 160232 1
- Page 235 and 236:
Continuação SH 6 PRODUTO Importa
- Page 237 and 238:
Continuação SH 6 PRODUTO Importa
- Page 240 and 241:
238 IÊMEN Iêmen: Capital: Sanaa P
- Page 242 and 243:
240 Tabela II - Principais Produtos
- Page 244 and 245:
242 Tabela IV - Principais Produtos
- Page 246 and 247:
244 Tabela V - Importações do Pa
- Page 248 and 249:
246 QueStõeS SPS No ÂMBito Bilate
- Page 250 and 251:
248 ÍNDIA Índia: Capital: Nova D
- Page 252 and 253:
250 Continuação Tabela II - Princ
- Page 254 and 255:
252 Continuação PRODUTO 2007 US$
- Page 256 and 257:
254 Tabela V - Importações do Pa
- Page 258 and 259:
256 Continuação SH 6 PRODUTO Inte
- Page 260 and 261:
258 PoNto de coNtato Para coNveNç
- Page 262 and 263:
260 INDoNÉSIA Indonésia: Capital:
- Page 264 and 265:
262 Continuação Tabela II - Princ
- Page 266 and 267:
264 Continuação PRODUTO Tabela IV
- Page 268 and 269:
266 V-A: Participação brasileira
- Page 270 and 271:
268 Continuação SH 6 PRODUTO Tabe
- Page 272 and 273:
270 a exigência de “país livre
- Page 274 and 275:
272 IRÃ Irã: Capital: Teerã Popu
- Page 276 and 277:
274 Tabela II - Principais Produtos
- Page 278 and 279:
276 Continuação PRODUTO 2007 US$
- Page 280 and 281:
278 Continuação SH 6 PRODUTO Tabe
- Page 282 and 283:
280 Continuação SH 6 PRODUTO 1517
- Page 284:
282 PARTE V REGIME TARIFÁRIO PARA
- Page 287 and 288:
PARTE I O COMÉRCIO BILATERAL BRASI
- Page 289 and 290:
O principal item de exportação do
- Page 291 and 292:
9% 7% Gráfico IV - Exportações A
- Page 293 and 294:
Continuação SH 6 PRODUTO 190190 O
- Page 295 and 296:
Continuação SH 6 PRODUTO 220421 O
- Page 297 and 298:
Continuação SH 6 PRODUTO Importa
- Page 299 and 300:
acordoS MultilateraiS JAPÃO O paí
- Page 301 and 302:
Continuação NCM LT do país Descr
- Page 303 and 304:
PARTE I O COMÉRCIO BILATERAL BRASI
- Page 305 and 306:
Tabela III - Principais Produtos Ag
- Page 307 and 308:
Tabela V - Importações do País e
- Page 309 and 310:
Continuação SH 6 PRODUTO Importa
- Page 311 and 312:
Continuação SH 6 PRODUTO 30379 Ou
- Page 313 and 314:
KUWAIT PoNto de coNtato JuNto à or
- Page 315 and 316:
PARTE I O COMÉRCIO BILATERAL BRASI
- Page 317 and 318:
US$ milhões Gráfico II - Comérci
- Page 319 and 320:
0% 3% 1% 5% 15% 13% 0% Gráfico IV
- Page 321 and 322:
Continuação SH 6 PRODUTO Importa
- Page 323 and 324:
Continuação SH 6 PRODUTO Importa
- Page 325 and 326:
Continuação SH 6 PRODUTO Importa
- Page 327 and 328:
Federal Government Administration C
- Page 329 and 330:
PARTE I O COMÉRCIO BILATERAL BRASI
- Page 331 and 332:
adotado nesta publicação, foram i
- Page 333 and 334:
Gráfico IV - Exportações Agríco
- Page 335 and 336:
Tabela V - Importações do País e
- Page 337 and 338:
PARTE IV ASSUNTOS SANITÁRIOS E FIT
- Page 339 and 340:
PARTE V Tabela VII - Tarifa para os
- Page 341 and 342:
Continuação NCM LT do país Descr
- Page 343 and 344:
PARTE I O COMÉRCIO BILATERAL BRASI
- Page 345 and 346:
Entre os produtos agrícolas export
- Page 347 and 348:
Gráfico VI - Valor das Importaçõ
- Page 349 and 350:
Tabela V - Importações do País e
- Page 351 and 352:
NIGÉRIA PoNto de coNtato JuNto à
- Page 354 and 355:
352 RÚSSIA Rússia: Capital: Mosco
- Page 356 and 357:
354 Tabela II - Principais Produtos
- Page 358 and 359:
356 Tabela IV - Principais Produtos
- Page 360 and 361:
358 Continuação SH 6 PRODUTO Tabe
- Page 362 and 363:
360 Continuação SH 6 PRODUTO 1805
- Page 364 and 365:
362 Continuação SH 6 PRODUTO 1513
- Page 366 and 367:
364 PARTE IV ASSUNTOS SANITÁRIOS E
- Page 368 and 369:
366 PoNto de coNtato JuNto à orgaN
- Page 370:
368 Continuação NCM LT do país D
- Page 373 and 374:
PARTE I O COMÉRCIO BILATERAL BRASI
- Page 375 and 376:
apenas um produto: sementes de anis
- Page 377 and 378:
Gráfico IV - Exportações Agríco
- Page 379 and 380:
Tabela V - Importações do País e
- Page 381 and 382:
Continuação SH 6 PRODUTO 200520 B
- Page 383 and 384:
Continuação NCM LT do país Descr
- Page 385 and 386:
PARTE I O COMÉRCIO BILATERAL BRASI
- Page 387 and 388:
das de grãos e farelo de soja soma
- Page 389 and 390:
Continuação PRODUTO TAILÂNDIA 20
- Page 391 and 392:
Tabela V - Importações do País e
- Page 393 and 394:
Tabela V - Importações do País e
- Page 395 and 396:
Continuação SH 6 PRODUTO 130239 8
- Page 397 and 398:
PARTE V TAILÂNDIA REGIME TARIFÁRI
- Page 399 and 400:
PARTE I O COMÉRCIO BILATERAL BRASI
- Page 401 and 402:
As exportações dos dois produtos
- Page 403 and 404:
Continuação 0% Gráfico IV - Expo
- Page 405 and 406:
Continuação SH 6 PRODUTO 190190 1
- Page 407 and 408:
Tabela V - Importações do País e
- Page 409 and 410:
Continuação SH 6 PRODUTO Importa
- Page 411 and 412:
PARTE V REGIME TARIFÁRIO PARA OS V
- Page 414 and 415:
412 uNIÃo EuRoPEIA União Europeia
- Page 416 and 417:
414 Continuação PRODUTO 2007 US$
- Page 418 and 419:
416 Continuação PRODUTO 2007 US$
- Page 420 and 421:
418 Gráfico VI - Valor das Importa
- Page 422 and 423:
420 Continuação SH 6 PRODUTO 1701
- Page 424 and 425:
422 Continuação SH 6 PRODUTO Inte
- Page 426 and 427:
424 Continuação SH 6 PRODUTO Inte
- Page 428 and 429:
426 acordoS MultilateraiS O bloco
- Page 430 and 431:
428 Continuação NCM LT do país D
- Page 432:
430 Continuação Linhas tarifária
- Page 435 and 436:
PARTE I O COMÉRCIO BILATERAL BRASI
- Page 437 and 438:
US$ milhões Gráfico II - Comérci
- Page 439 and 440:
9% 2% 3% 9% 15% Gráfico IV - Expor
- Page 441 and 442:
Tabela V - Importações do País e
- Page 443 and 444:
Continuação SH 6 PRODUTO 190410 3
- Page 445:
PARTE V VENEZUELA REGIME TARIFÁRIO