- Page 3:
Ministério da Agricultura, Pecuár
- Page 7 and 8:
Sumário NotaS MetodológicaS .....
- Page 9 and 10:
NOTAS METODOLÓGICAS Notas Metodol
- Page 12 and 13:
10 introdução PARTE I AGRONEGÓCI
- Page 14 and 15:
12 Em uma análise de mais longo pr
- Page 16 and 17:
14 Tabela 2 - Evolução dos preço
- Page 18 and 19:
16 Os bons preços em dólar não e
- Page 20 and 21:
18 Continuação Razões de Concent
- Page 22 and 23:
20 Continuação País A análise p
- Page 24 and 25:
22 UE-27 Coreia do Sul Rússia Chin
- Page 26 and 27:
24 Continuação País / Bloco Tabe
- Page 28 and 29:
26 Na Tabela 11, são apresentados
- Page 30 and 31:
28 Continuação US$ bilhões 170 1
- Page 32:
Intercâmbio Comercial do Agronegó
- Page 35 and 36:
PARTE I O COMÉRCIO BILATERAL BRASI
- Page 37 and 38:
600 500 400 300 200 US$ milhões Gr
- Page 39 and 40:
Continuação 16% Gráfico IV - Exp
- Page 41 and 42:
Tabela V - Importações do País e
- Page 43 and 44:
Continuação SH 6 PRODUTO Importa
- Page 45 and 46:
PARTE IV ASSUNTOS SANITÁRIOS E FIT
- Page 47 and 48:
Continuação NCM 1507.90.19 - ÓLE
- Page 49 and 50:
PARTE I O COMÉRCIO BILATERAL BRASI
- Page 51 and 52:
US$ milhões Gráfico II - Comérci
- Page 53 and 54:
Tabela V - Importações do País e
- Page 55 and 56:
Continuação SH 6 PRODUTO Importa
- Page 57 and 58:
Fax : +244 222 323724 Email : secre
- Page 60 and 61:
58 ARÁBIA SAuDITA Arábia Saudita:
- Page 62 and 63:
60 Tabela II - Principais Produtos
- Page 64 and 65:
62 Continuação Total: US$ 769 mil
- Page 66 and 67:
64 Tabela V - Importações do Paí
- Page 68 and 69:
66 Continuação SH 6 PRODUTO Inter
- Page 70 and 71:
68 PARTE IV ASSUNTOS SANITÁRIOS E
- Page 72 and 73:
70 ARGÉlIA Argélia: Capital: Arge
- Page 74 and 75:
72 Tabela II - Principais Produtos
- Page 76 and 77:
74 Tabela IV - Principais Produtos
- Page 78 and 79:
76 Tabela V - Importações do Paí
- Page 80 and 81:
78 QueStõeS SPS No ÂMBito Bilater
- Page 82 and 83:
80 ARGENTINA Argentina: Capital: Bu
- Page 84 and 85:
82 Continuação PRODUTO OUTROS VE
- Page 86 and 87:
84 Continuação PRODUTO Tabela IV
- Page 88 and 89:
86 Gráfico VI - Valor das Importa
- Page 90 and 91:
88 Tabela V - Importações do Paí
- Page 92 and 93:
90 Continuação SH 6 PRODUTO 19059
- Page 94 and 95:
92 PoNto de coNtato Para coNveNçã
- Page 96 and 97:
94 BANGlADESH Bangladesh: Capital:
- Page 98 and 99:
96 Tabela II - Principais Produtos
- Page 100 and 101:
98 Tabela IV - Principais Produtos
- Page 102 and 103:
100 Continuação SH 6 PRODUTO Tabe
- Page 104 and 105:
102 QueStõeS SPS No ÂMBito Bilate
- Page 106 and 107:
104 CANADÁ Canadá: Capital: Ottaw
- Page 108 and 109:
106 Tabela II - Principais Produtos
- Page 110 and 111:
108 Tabela IV - Principais Produtos
- Page 112 and 113:
110 Tabela V - Importações do Pa
- Page 114 and 115:
112 Tabela V - Importações do Pa
- Page 116 and 117:
114 Continuação SH 6 PRODUTO Inte
- Page 118 and 119:
116 Continuação SH 6 PRODUTO Inte
- Page 120 and 121:
118 PARTE IV ASSUNTOS SANITÁRIOS E
- Page 122:
120 Continuação 1201.00.90 - OUTR
- Page 125 and 126:
PARTE I O COMÉRCIO BILATERAL BRASI
- Page 127 and 128:
US$ milhões 8.000 7.000 6.000 5.00
- Page 129 and 130:
Continuação Gráfico IV - Exporta
- Page 131 and 132:
Tabela V - Importações do País e
- Page 133 and 134:
Continuação SH 6 PRODUTO 151620 2
- Page 135 and 136:
CHINA Em decorrência dos focos de
- Page 137 and 138:
Tabela VIII - Cotas Tarifárias par
- Page 139 and 140:
PARTE I O COMÉRCIO BILATERAL BRASI
- Page 141 and 142:
Tabela III - Principais Produtos Ag
- Page 143 and 144:
Gráfico IV - Exportações Agríco
- Page 145 and 146:
Continuação SH 6 PRODUTO 20712 18
- Page 147 and 148:
Continuação SH 6 PRODUTO Importa
- Page 149 and 150:
Continuação SH 6 PRODUTO Importa
- Page 151 and 152:
Continuação SH 6 PRODUTO Importa
- Page 153 and 154:
PARTE V Tabela VII - Tarifa para os
- Page 155 and 156:
PARTE I O COMÉRCIO BILATERAL BRASI
- Page 157 and 158:
Dentre os produtos agrícolas expor
- Page 159 and 160:
Total: US$ 89 milhões 4% 2% 11% 13
- Page 161 and 162:
Continuação SH 6 PRODUTO Tabela V
- Page 163 and 164:
Continuação SH 6 PRODUTO Importa
- Page 165 and 166:
Person in charge: Daniel Hector Ric
- Page 167 and 168:
PARTE I O COMÉRCIO BILATERAL BRASI
- Page 169 and 170:
Esse grande incremento nas exporta
- Page 171 and 172:
Continuação 4% Gráfico IV - Expo
- Page 173 and 174:
Tabela V - Importações do País e
- Page 175 and 176:
Tabela V - Importações do País e
- Page 177 and 178:
Continuação SH 6 PRODUTO 230120 F
- Page 179 and 180:
COREIA DO SUL PoNto de coNtato Para
- Page 181 and 182:
COREIA DO SUL Tabela VIII - Cotas T
- Page 183 and 184:
PARTE I O COMÉRCIO BILATERAL BRASI
- Page 185 and 186:
US$ milhões 900 800 700 600 500 40
- Page 187 and 188:
Gráfico IV - Exportações Agríco
- Page 189 and 190:
Continuação SH 6 PRODUTO Tabela V
- Page 191 and 192:
QueStõeS SPS No ÂMBito Bilateral
- Page 194 and 195:
192 EMIRADoS ÁRABES uNIDoS Emirado
- Page 196 and 197:
194 Na pauta de importações brasi
- Page 198 and 199:
196 Continuação PRODUTO Intercâm
- Page 200 and 201:
198 Continuação SH 6 PRODUTO 1601
- Page 202 and 203:
200 Continuação SH 6 PRODUTO 1902
- Page 204 and 205:
202 Continuação SH 6 PRODUTO 2204
- Page 206 and 207:
204 PARTE IV ASSUNTOS SANITÁRIOS E
- Page 208 and 209:
206 ESTADoS uNIDoS Washington, DC.
- Page 210 and 211:
208 Tabela II - Principais Produtos
- Page 212 and 213:
210 Tabela IV - Principais Produtos
- Page 214 and 215:
212 Tabela V - Importações do Pa
- Page 216 and 217:
214 Continuação SH 6 PRODUTO 1806
- Page 218 and 219:
216 Continuação SH 6 PRODUTO Inte
- Page 220 and 221:
218 Continuação SH 6 PRODUTO Inte
- Page 222 and 223:
220 acordoS MultilateraiS O país
- Page 224:
222 Continuação 2009.19.00 - OUTR
- Page 227 and 228:
PARTE I O COMÉRCIO BILATERAL BRASI
- Page 229 and 230:
US$ milhões Gráfico II - Comérci
- Page 231 and 232:
Total: US$ 381 milhões 1% 1% Gráf
- Page 233 and 234:
Continuação SH 6 PRODUTO 160232 1
- Page 235 and 236:
Continuação SH 6 PRODUTO Importa
- Page 237 and 238:
Continuação SH 6 PRODUTO Importa
- Page 240 and 241:
238 IÊMEN Iêmen: Capital: Sanaa P
- Page 242 and 243:
240 Tabela II - Principais Produtos
- Page 244 and 245:
242 Tabela IV - Principais Produtos
- Page 246 and 247:
244 Tabela V - Importações do Pa
- Page 248 and 249:
246 QueStõeS SPS No ÂMBito Bilate
- Page 250 and 251:
248 ÍNDIA Índia: Capital: Nova D
- Page 252 and 253:
250 Continuação Tabela II - Princ
- Page 254 and 255:
252 Continuação PRODUTO 2007 US$
- Page 256 and 257:
254 Tabela V - Importações do Pa
- Page 258 and 259:
256 Continuação SH 6 PRODUTO Inte
- Page 260 and 261:
258 PoNto de coNtato Para coNveNç
- Page 262 and 263:
260 INDoNÉSIA Indonésia: Capital:
- Page 264 and 265:
262 Continuação Tabela II - Princ
- Page 266 and 267: 264 Continuação PRODUTO Tabela IV
- Page 268 and 269: 266 V-A: Participação brasileira
- Page 270 and 271: 268 Continuação SH 6 PRODUTO Tabe
- Page 272 and 273: 270 a exigência de “país livre
- Page 274 and 275: 272 IRÃ Irã: Capital: Teerã Popu
- Page 276 and 277: 274 Tabela II - Principais Produtos
- Page 278 and 279: 276 Continuação PRODUTO 2007 US$
- Page 280 and 281: 278 Continuação SH 6 PRODUTO Tabe
- Page 282 and 283: 280 Continuação SH 6 PRODUTO 1517
- Page 284: 282 PARTE V REGIME TARIFÁRIO PARA
- Page 287 and 288: PARTE I O COMÉRCIO BILATERAL BRASI
- Page 289 and 290: O principal item de exportação do
- Page 291 and 292: 9% 7% Gráfico IV - Exportações A
- Page 293 and 294: Continuação SH 6 PRODUTO 190190 O
- Page 295 and 296: Continuação SH 6 PRODUTO 220421 O
- Page 297 and 298: Continuação SH 6 PRODUTO Importa
- Page 299 and 300: acordoS MultilateraiS JAPÃO O paí
- Page 301 and 302: Continuação NCM LT do país Descr
- Page 303 and 304: PARTE I O COMÉRCIO BILATERAL BRASI
- Page 305 and 306: Tabela III - Principais Produtos Ag
- Page 307 and 308: Tabela V - Importações do País e
- Page 309 and 310: Continuação SH 6 PRODUTO Importa
- Page 311 and 312: Continuação SH 6 PRODUTO 30379 Ou
- Page 313 and 314: KUWAIT PoNto de coNtato JuNto à or
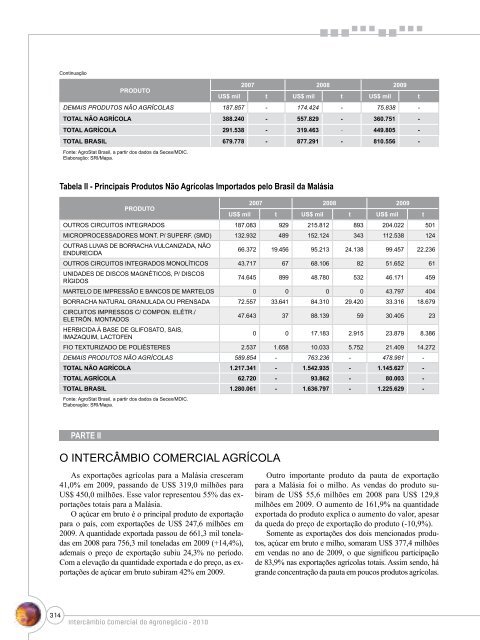
- Page 315: PARTE I O COMÉRCIO BILATERAL BRASI
- Page 319 and 320: 0% 3% 1% 5% 15% 13% 0% Gráfico IV
- Page 321 and 322: Continuação SH 6 PRODUTO Importa
- Page 323 and 324: Continuação SH 6 PRODUTO Importa
- Page 325 and 326: Continuação SH 6 PRODUTO Importa
- Page 327 and 328: Federal Government Administration C
- Page 329 and 330: PARTE I O COMÉRCIO BILATERAL BRASI
- Page 331 and 332: adotado nesta publicação, foram i
- Page 333 and 334: Gráfico IV - Exportações Agríco
- Page 335 and 336: Tabela V - Importações do País e
- Page 337 and 338: PARTE IV ASSUNTOS SANITÁRIOS E FIT
- Page 339 and 340: PARTE V Tabela VII - Tarifa para os
- Page 341 and 342: Continuação NCM LT do país Descr
- Page 343 and 344: PARTE I O COMÉRCIO BILATERAL BRASI
- Page 345 and 346: Entre os produtos agrícolas export
- Page 347 and 348: Gráfico VI - Valor das Importaçõ
- Page 349 and 350: Tabela V - Importações do País e
- Page 351 and 352: NIGÉRIA PoNto de coNtato JuNto à
- Page 354 and 355: 352 RÚSSIA Rússia: Capital: Mosco
- Page 356 and 357: 354 Tabela II - Principais Produtos
- Page 358 and 359: 356 Tabela IV - Principais Produtos
- Page 360 and 361: 358 Continuação SH 6 PRODUTO Tabe
- Page 362 and 363: 360 Continuação SH 6 PRODUTO 1805
- Page 364 and 365: 362 Continuação SH 6 PRODUTO 1513
- Page 366 and 367:
364 PARTE IV ASSUNTOS SANITÁRIOS E
- Page 368 and 369:
366 PoNto de coNtato JuNto à orgaN
- Page 370:
368 Continuação NCM LT do país D
- Page 373 and 374:
PARTE I O COMÉRCIO BILATERAL BRASI
- Page 375 and 376:
apenas um produto: sementes de anis
- Page 377 and 378:
Gráfico IV - Exportações Agríco
- Page 379 and 380:
Tabela V - Importações do País e
- Page 381 and 382:
Continuação SH 6 PRODUTO 200520 B
- Page 383 and 384:
Continuação NCM LT do país Descr
- Page 385 and 386:
PARTE I O COMÉRCIO BILATERAL BRASI
- Page 387 and 388:
das de grãos e farelo de soja soma
- Page 389 and 390:
Continuação PRODUTO TAILÂNDIA 20
- Page 391 and 392:
Tabela V - Importações do País e
- Page 393 and 394:
Tabela V - Importações do País e
- Page 395 and 396:
Continuação SH 6 PRODUTO 130239 8
- Page 397 and 398:
PARTE V TAILÂNDIA REGIME TARIFÁRI
- Page 399 and 400:
PARTE I O COMÉRCIO BILATERAL BRASI
- Page 401 and 402:
As exportações dos dois produtos
- Page 403 and 404:
Continuação 0% Gráfico IV - Expo
- Page 405 and 406:
Continuação SH 6 PRODUTO 190190 1
- Page 407 and 408:
Tabela V - Importações do País e
- Page 409 and 410:
Continuação SH 6 PRODUTO Importa
- Page 411 and 412:
PARTE V REGIME TARIFÁRIO PARA OS V
- Page 414 and 415:
412 uNIÃo EuRoPEIA União Europeia
- Page 416 and 417:
414 Continuação PRODUTO 2007 US$
- Page 418 and 419:
416 Continuação PRODUTO 2007 US$
- Page 420 and 421:
418 Gráfico VI - Valor das Importa
- Page 422 and 423:
420 Continuação SH 6 PRODUTO 1701
- Page 424 and 425:
422 Continuação SH 6 PRODUTO Inte
- Page 426 and 427:
424 Continuação SH 6 PRODUTO Inte
- Page 428 and 429:
426 acordoS MultilateraiS O bloco
- Page 430 and 431:
428 Continuação NCM LT do país D
- Page 432:
430 Continuação Linhas tarifária
- Page 435 and 436:
PARTE I O COMÉRCIO BILATERAL BRASI
- Page 437 and 438:
US$ milhões Gráfico II - Comérci
- Page 439 and 440:
9% 2% 3% 9% 15% Gráfico IV - Expor
- Page 441 and 442:
Tabela V - Importações do País e
- Page 443 and 444:
Continuação SH 6 PRODUTO 190410 3
- Page 445:
PARTE V VENEZUELA REGIME TARIFÁRIO