137 TABELA 4.39 – VALORES AGRUPADOS PARA OS CENTROS COMERCIAIS DE PEQUENO E MÉDIO PORTE Porte (número <strong>de</strong> lojas) Pequeno (até 40) Médio (entre 40 e 100) CC 20 16 18 15 17 19 11 14 9 Número <strong>de</strong> lojas 0,481 0,263 0,150 0,107 0,405 0,405 0,088 0,061 0,042 Cin<strong>em</strong>a 0,250 0,250 0,250 0,250 0,243 0,243 0,027 0,243 0,243 Praça <strong>de</strong> Alimentação 0,321 0,321 0,036 0,321 0,692 0,077 0,077 0,077 0,077 Gestão 0,250 0,250 0,250 0,250 0,238 0,238 0,048 0,238 0,238 Realização da Coleta Seletiva 0,083 0,083 0,083 0,750 0,048 0,048 0,429 0,429 0,048 Controle na Separação 0,045 0,165 0,625 0,165 0,118 0,075 0,319 0,319 0,168 Recipientes da área <strong>de</strong> circulação 0,073 0,073 0,392 0,462 0,111 0,111 0,111 0,556 0,111 Recipientes da praça <strong>de</strong> alimentação 0,299 0,299 0,218 0,183 0,480 0,102 0,158 0,102 0,158 Recipientes da área externa 0,308 0,308 0,308 0,077 0,243 0,243 0,027 0,243 0,243 Acondicionamento nos recipientes <strong>de</strong> rejeitos 0,250 0,250 0,250 0,250 0,200 0,200 0,200 0,200 0,200 Acondicionam ento nos recipientes <strong>do</strong>s recicláveis 0,250 0,250 0,250 0,250 0,077 0,077 0,077 0,692 0,077 Acondicionamento no armazenamento <strong>do</strong>s rejeitos 0,308 0,077 0,308 0,308 0,555 0,137 0,036 0,137 0,137 Acondicionamento no armazenamento <strong>do</strong>s recicláveis 0,286 0,143 0,286 0,286 0,059 0,199 0,105 0,578 0,059 Resíduos sóli<strong>do</strong>s <strong>do</strong>s lojistas da praça <strong>de</strong> alimentação 0,321 0,321 0,036 0,321 0,485 0,056 0,201 0,201 0,056 Resíduos sóli<strong>do</strong>s <strong>do</strong>s lojistas comuns 0,395 0,092 0,395 0,118 0,059 0,059 0,294 0,294 0,294 Resíduos sóli<strong>do</strong>s <strong>do</strong>s cin<strong>em</strong>as 0,250 0,250 0,250 0,250 0,243 0,243 0,027 0,243 0,243 Transporte interno 0,165 0,165 0,625 0,045 0,048 0,238 0,238 0,238 0,238 Resíduos <strong>de</strong> Serviços <strong>de</strong> Saú<strong>de</strong> 0,250 0,250 0,250 0,250 0,243 0,027 0,243 0,243 0,243 Área específica para armazenamento 0,250 0,250 0,250 0,250 0,200 0,200 0,200 0,200 0,200 Área <strong>de</strong> armazenamento para cada tipo <strong>de</strong> resíduo sóli<strong>do</strong> 0,250 0,250 0,250 0,250 0,034 0,034 0,310 0,310 0,310 Armazenamento das lâmpadas 0,250 0,250 0,250 0,250 0,581 0,148 0,044 0,148 0,079 Controle na quantida<strong>de</strong> <strong>de</strong> resíduo gerada 0,250 0,250 0,250 0,250 0,200 0,200 0,200 0,200 0,200 Coleta <strong>do</strong>s rejeitos 0,083 0,083 0,417 0,417 0,200 0,200 0,200 0,200 0,200 Destino final <strong>do</strong>s rejeitos 0,250 0,250 0,250 0,250 0,243 0,243 0,027 0,243 0,243 Destino final <strong>do</strong>s recicláveis 0,077 0,262 0,399 0,262 0,120 0,440 0,055 0,199 0,186 Montante arrecada<strong>do</strong> 0,250 0,250 0,250 0,250 0,090 0,414 0,207 0,090 0,199 Soma 6,246 5,655 7,277 6,821 6,216 4,658 3,948 6,685 4,493 Legenda: Azul: valores diferencia<strong>do</strong>s <strong>do</strong>s CC consi<strong>de</strong>ra<strong>do</strong>s mais a<strong>de</strong>qua<strong>do</strong>s; Vermelho: valores diferencia<strong>do</strong>s <strong>do</strong>s CC consi<strong>de</strong>ra<strong>do</strong>s menos a<strong>de</strong>qua<strong>do</strong>s
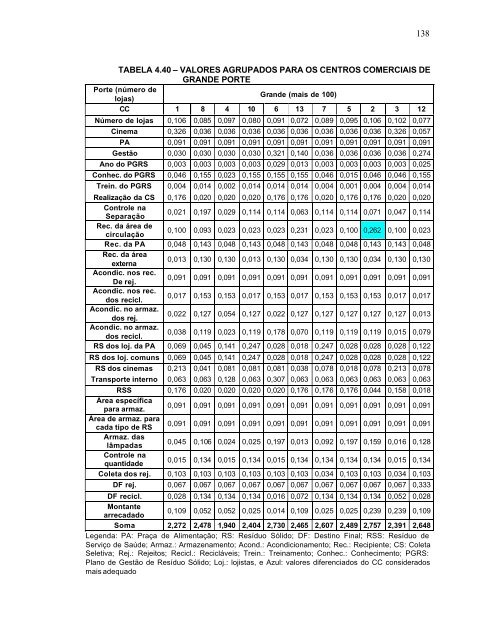
138 TABELA 4.40 – VALORES AGRUPADOS PARA OS CENTROS COMERCIAIS DE GRANDE PORTE Porte (número <strong>de</strong> Gran<strong>de</strong> (mais <strong>de</strong> 100) lojas) CC 1 8 4 10 6 13 7 5 2 3 12 Número <strong>de</strong> lojas 0,106 0,085 0,097 0,080 0,091 0,072 0,089 0,095 0,106 0,102 0,077 Cin<strong>em</strong>a 0,326 0,036 0,036 0,036 0,036 0,036 0,036 0,036 0,036 0,326 0,057 PA 0,091 0,091 0,091 0,091 0,091 0,091 0,091 0,091 0,091 0,091 0,091 Gestão 0,030 0,030 0,030 0,030 0,321 0,140 0,036 0,036 0,036 0,036 0,274 Ano <strong>do</strong> PGRS 0,003 0,003 0,003 0,003 0,029 0,013 0,003 0,003 0,003 0,003 0,025 Conhec. <strong>do</strong> PGRS 0,046 0,155 0,023 0,155 0,155 0,155 0,046 0,015 0,046 0,046 0,155 Trein. <strong>do</strong> PGRS 0,004 0,014 0,002 0,014 0,014 0,014 0,004 0,001 0,004 0,004 0,014 Realização da CS 0,176 0,020 0,020 0,020 0,176 0,176 0,020 0,176 0,176 0,020 0,020 Controle na Separação 0,021 0,197 0,029 0,114 0,114 0,063 0,114 0,114 0,071 0,047 0,114 Rec. da área <strong>de</strong> circulação 0,100 0,093 0,023 0,023 0,023 0,231 0,023 0,100 0,262 0,100 0,023 Rec. da PA 0,048 0,143 0,048 0,143 0,048 0,143 0,048 0,048 0,143 0,143 0,048 Rec. da área externa 0,013 0,130 0,130 0,013 0,130 0,034 0,130 0,130 0,034 0,130 0,130 Acondic. nos rec. De rej. 0,091 0,091 0,091 0,091 0,091 0,091 0,091 0,091 0,091 0,091 0,091 Acondic. nos rec. <strong>do</strong>s recicl. 0,017 0,153 0,153 0,017 0,153 0,017 0,153 0,153 0,153 0,017 0,017 Acondic. no armaz. <strong>do</strong>s rej. 0,022 0,127 0,054 0,127 0,022 0,127 0,127 0,127 0,127 0,127 0,013 Acondic. no armaz. <strong>do</strong>s recicl. 0,038 0,119 0,023 0,119 0,178 0,070 0,119 0,119 0,119 0,015 0,079 RS <strong>do</strong>s loj. da PA 0,069 0,045 0,141 0,247 0,028 0,018 0,247 0,028 0,028 0,028 0,122 RS <strong>do</strong>s loj. comuns 0,069 0,045 0,141 0,247 0,028 0,018 0,247 0,028 0,028 0,028 0,122 RS <strong>do</strong>s cin<strong>em</strong>as 0,213 0,041 0,081 0,081 0,081 0,038 0,078 0,018 0,078 0,213 0,078 Transporte interno 0,063 0,063 0,128 0,063 0,307 0,063 0,063 0,063 0,063 0,063 0,063 RSS 0,176 0,020 0,020 0,020 0,020 0,176 0,176 0,176 0,044 0,158 0,018 Área específica para armaz. 0,091 0,091 0,091 0,091 0,091 0,091 0,091 0,091 0,091 0,091 0,091 Área <strong>de</strong> armaz. para cada tipo <strong>de</strong> RS 0,091 0,091 0,091 0,091 0,091 0,091 0,091 0,091 0,091 0,091 0,091 Armaz. das lâmpadas 0,045 0,106 0,024 0,025 0,197 0,013 0,092 0,197 0,159 0,016 0,128 Controle na quantida<strong>de</strong> 0,015 0,134 0,015 0,134 0,015 0,134 0,134 0,134 0,134 0,015 0,134 Coleta <strong>do</strong>s rej. 0,103 0,103 0,103 0,103 0,103 0,103 0,034 0,103 0,103 0,034 0,103 DF rej. 0,067 0,067 0,067 0,067 0,067 0,067 0,067 0,067 0,067 0,067 0,333 DF recicl. 0,028 0,134 0,134 0,134 0,016 0,072 0,134 0,134 0,134 0,052 0,028 Montante 0,109 0,052 0,052 0,025 0,014 0,109 0,025 0,025 0,239 0,239 0,109 arrecada<strong>do</strong> Soma 2,272 2,478 1,940 2,404 2,730 2,465 2,607 2,489 2,757 2,391 2,648 Legenda: PA: Praça <strong>de</strong> Alimentação; RS: Resíduo Sóli<strong>do</strong>; DF: Destino Final; RSS: Resíduo <strong>de</strong> Serviço <strong>de</strong> Saú<strong>de</strong>; Armaz.: Armazenamento; Acond.: Acondicionamento; Rec.: Recipiente; CS: Coleta Seletiva; Rej.: Rejeitos; Recicl.: Recicláveis; Trein.: Treinamento; Conhec.: Conhecimento; PGRS: Plano <strong>de</strong> Gestão <strong>de</strong> Resíduo Sóli<strong>do</strong>; Loj.: lojistas, e Azul: valores diferencia<strong>do</strong>s <strong>do</strong> CC consi<strong>de</strong>ra<strong>do</strong>s mais a<strong>de</strong>qua<strong>do</strong>
- Page 1 and 2:
UNIVERSIDADE FEDERAL DO PARANÁ PAT
- Page 3 and 4:
3 AGRADECIMENTOS À Deus pela vida,
- Page 5 and 6:
5 ABSTRACT Presently, the problems
- Page 7 and 8:
COMERCIAIS ESTUDADOS...............
- Page 9 and 10:
COMERCIAIS ESTUDADOS...............
- Page 11 and 12:
11 LISTA DE ANEXOS ANEXO A - QUESTI
- Page 13 and 14:
13 RMC - Região Metropolitana de C
- Page 15 and 16:
3.5.1. Estatística descritiva.....
- Page 17 and 18:
2 Para melhorar a eficiência da se
- Page 19 and 20:
4 OBJETIVO GERAL Esta pesquisa teve
- Page 21 and 22:
6 2.1.1.1. CLASSIFICAÇÃO SEGUNDO
- Page 23 and 24:
8 alumínio, caixas tetra pak, suca
- Page 25 and 26:
10 população, para atingir a máx
- Page 27 and 28:
12 municípios, da GIRS, esses fato
- Page 29 and 30:
14 Para BERTOLDI e PEREIRA (2005) o
- Page 31 and 32:
16 lâmpadas que não estejam quebr
- Page 33 and 34:
18 Como vantagens da CS podem ser c
- Page 35 and 36:
20 a. RECICLAGEM DE RESÍDUOS SÓLI
- Page 37 and 38:
22 resíduos coletados, ou seja, ap
- Page 39 and 40:
24 estrutura (como galpões de reci
- Page 41 and 42:
26 permite um confinamento seguro,
- Page 43 and 44:
28 2.3.2. PROJETO DE LEI (PL) N o 1
- Page 45 and 46:
30 poluição e/ou contaminação o
- Page 47 and 48:
32 estabelecidos neste decreto fica
- Page 49 and 50:
34 de Curitiba, estabelecimentos qu
- Page 51 and 52:
36 identificação e caracterizaç
- Page 53 and 54:
38 melhores práticas para adotar u
- Page 55 and 56:
40 Nordeste 14% Norte 3% Centro-oes
- Page 57 and 58:
42 Um dos méritos dos sistemas ISO
- Page 59 and 60:
44 3. MATERIAL E MÉTODOS A metodol
- Page 61 and 62:
46 podem, orientam os visitantes a
- Page 63 and 64:
48 TABELA 3.2 - RESUMO DA GESTÃO D
- Page 65 and 66:
50 3.3 ELABORAÇÃO DOS QUESTIONÁR
- Page 67 and 68:
52 responder a questões específic
- Page 69 and 70:
54 TABELA 3.4 - CRITÉRIOS DE GEST
- Page 71 and 72:
56 TABELA 3.6 - COMPARAÇÃO AOS PA
- Page 73 and 74:
58 λmax − n CI = n −1 (7) Fina
- Page 75 and 76:
60 4. APRESENTAÇÃO E DISCUSSÃO D
- Page 77 and 78:
62 Vale salientar, também, que dos
- Page 79 and 80:
64 TABELA 4.3 - TIPO DE GESTÃO DE
- Page 81 and 82:
66 responsáveis por uma quantidade
- Page 83 and 84:
68 TABELA 4.8 - COLETA SELETIVA EM
- Page 85 and 86:
70 CONTROLE NA SEPARAÇÃO FIGURA 4
- Page 87 and 88:
72 Estudando a Lei Municipal 12.382
- Page 89 and 90:
74 TABELA 4.10 - DIVISÕES DOS RECI
- Page 91 and 92:
76 a b c d a: Recipiente da praça
- Page 93 and 94:
78 Das informações apresentadas n
- Page 95 and 96:
80 a forma de acondicionamento que
- Page 97 and 98:
82 5% 5% Saco preto 25% Saco azul e
- Page 99 and 100:
84 encaminhados à uma empresa. Nes
- Page 101 and 102: 86 TABELA 4.14 - FORMA DE ACONDICIO
- Page 103 and 104: 88 4.1.2.4. RESÍDUOS GERADOS PELOS
- Page 105 and 106: 90 10% 10% 25% No corredor No corre
- Page 107 and 108: 92 de carrinhos (Figura 4.19); em t
- Page 109 and 110: 94 4.1.2.6. RESÍDUOS PERIGOSOS ENC
- Page 111 and 112: 96 5% 5% 5% Empresa de reciclagem 1
- Page 113 and 114: 98 acumulados em seus respectivos r
- Page 115 and 116: 100 a b c d e f a: Armazenamento do
- Page 117 and 118: 102 Em relação ao óleo de cozinh
- Page 119 and 120: 104 TABELA 4.19 - ESTIMATIVA DA QUA
- Page 121 and 122: 106 TABELA 4.20 - QUANTIDADE DE RES
- Page 123 and 124: 108 5% Todos os dias 10% 5% 25% 6 X
- Page 125 and 126: 110 custo de coleta e de destinaç
- Page 127 and 128: 112 A falta de interesse pode ser d
- Page 129 and 130: 114 2008 2007 FONTE: Shopping Plaza
- Page 131 and 132: 116 da geração dos recicláveis e
- Page 133 and 134: 118 entrevistados afirmaram que est
- Page 135 and 136: 120 Observando as sugestões ou rec
- Page 137 and 138: 122 observou-se que todos são do s
- Page 139 and 140: 124 4.4. QUESTIONÁRIO APLICADO AOS
- Page 141 and 142: 126 CONTINUAÇÃO TABELA 4.27 - CAR
- Page 143 and 144: 128 CONTINUAÇÃO TABELA 4.28 - DAD
- Page 145 and 146: 130 4.5.1. RELAÇÃO ENTRE O PORTE
- Page 147 and 148: 132 de cada grupo, os quais receber
- Page 149 and 150: 134 estudados (valor p de 0,012 par
- Page 151: 136 TABELA 4.38 - CRITÉRIOS DE GES
- Page 155 and 156: 140 resíduos sólidos, pois, além
- Page 157 and 158: 142 TABELA 4.45 - VALORES DOS MATER
- Page 159 and 160: 144 Desta forma, caso todos os cent
- Page 161 and 162: 146 disponibilização de recipient
- Page 163 and 164: 148 Portanto, pode-se concluir que
- Page 165 and 166: 150 BRASIL. Instituto Brasileiro de
- Page 167 and 168: 152 INSTITUTO BRASILEIRO DE GEOGRAF
- Page 169 and 170: 154 International Conference on Sol
- Page 171 and 172: 156 QUESTIONÁRIO GERENTE GERAIS SO
- Page 173 and 174: 158 _______________________________
- Page 175 and 176: 160 29. Em caso afirmativo, qual o
- Page 177 and 178: 162 QUESTIONÁRIO FUNCIONÁRIO GERA
- Page 179: 164 _______________________________