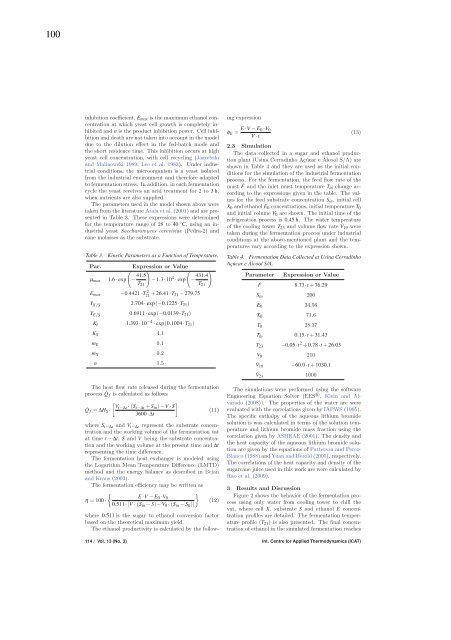
100inhibition coefficient, E max is the maxim<strong>um</strong> ethanol concentrationat which yeast cell growth is completely inhibitedand n is the product inhibition power. Cell inhibitionand <strong>de</strong>ath are not taken into account in the mo<strong>de</strong>ldue to the dilution effect in the fed-batch mo<strong>de</strong> andthe short resi<strong>de</strong>nce time. This inhibition occurs at highyeast cell concentration, with cell recycling (Jarzebskiand Malinowski 1989; Lee et al. 1983). Un<strong>de</strong>r industrialconditions, the microorganism is a yeast isolatedfrom the industrial environment and therefore adaptedto fermentation stress. In addition, in each fermentationcycle the yeast receives an acid treatment for 2 to 3h,when nutrients are also supplied.The parameters used in the mo<strong>de</strong>l shown above weretaken from the literature Atala et al. (2001) and are presentedin Table 3. These expressions were <strong>de</strong>terminedfor the temperature range of 28 to 40 ◦ C, using an industrialyeast Saccharomyces cerevisiae (Pedra-2) andcane molasses as the substrate.Table 3. Kinetic Parameters as a Function of Temperature.Par.Expression or Value(μ max 1.6· exp − 41.5)(− 1.3·10 4 · exp − 431.4)T 21 T 21E max −0.4421·T21 2 + 26.41·T21 − 279.75Y X/S 2.704· exp(−0.1225·T 21)Y E/S 0.6911· exp(−0.0139·T 21)K i 1.393·10 −4 · exp(0.1004·T 21)K S 4.1m E 0.1m X 0.2n 1.5The heat flow rate released during the fermentationprocess ˙Q f is calculated as follows[ ]Vt−Δt · (S˙Q f = ΔH S ·t−Δt + S in) −V ·S(11)3600·Δtwhere S t−Δt and V t−Δt represent the substrate concentrationand the working vol<strong>um</strong>e of the fermentation vatat time t − Δt, S and V being the substrate concentrationand the working vol<strong>um</strong>e at the present time and Δtrepresenting the time difference.The fermentation heat exchanger is mo<strong>de</strong>led usingthe Logarithm Mean Temperature Difference (LMTD)method and the energy balance as <strong>de</strong>scribed in Bejanand Kraus (2003).The fermentation efficiency may be written as{}E ·V − Eη = 100·0 ·V 0(12)0.511· [V · (S in − S) −V 0 · (S in − S 0)]where 0.511 is the sugar to ethanol conversion factorbased on the theoretical maxim<strong>um</strong> yield.The ethanol productivity is calculated by the followingexpressionE ·V − E0 ·V0φ E = (13)V ·t2.3 SimulationThe data collected in a sugar and ethanol productionplant (Usina Cerradinho Açúcar e Álcool S/A) areshown in Table 4 and they are used as the initial conditionsfor the simulation of the industrial fermentationprocess. For the fermentation, the feed flow rate of themust Ḟ and the inlet must temperature T in change accordingto the expressions given in the table. The valuesfor the feed substrate concentration S in, initialcellX 0 and ethanol E 0 concentrations, initial temperature T 0and initial vol<strong>um</strong>e V 0 are shown. The initial time of therefrigeration process is 0.45 h. The water temperatureof the cooling tower T 23 and vol<strong>um</strong>e flow rate ˙V 19 weretaken during the fermentation process un<strong>de</strong>r industrialconditions at the above-mentioned plant and the temperaturesvary according to the expression shown.Table 4. Fermentation Data Collected at Usina CerradinhoAçúcar e Álcool S/A.ParameterExpression or ValueḞ 8.73·t + 76.29S in 200E 0 34.56X 0 71.6T 0 28.37T in 0.15·t + 31.43T 23 −0.05·t 2 + 0.78·t + 26.03V 0 210˙V 19 −60.0·t + 1030.1˙V 21 1000The simulations were performed using the softwareEngineering Equation Solver (EES R , Klein and Alvarado(2008)). The properties of the water are wereevaluated with the correlations given by IAPWS (1995).The specific enthalpy of the aqueous lithi<strong>um</strong> bromi<strong>de</strong>solution is was calculated in terms of the solution temperatureand lithi<strong>um</strong> bromi<strong>de</strong> mass fraction using thecorrelation given by ASHRAE (2001). The <strong>de</strong>nsity andthe heat capacity of the aqueous lithi<strong>um</strong> bromi<strong>de</strong> solutionare given by the equations of Patterson and Perez-Blanco (1988)andYuan and Herold (2005), respectively.The correlations of the heat capacity and <strong>de</strong>nsity of thesugarcane juice used in this work are were calculated byRao et al. (2009).3 Results and DiscussionFigure 2 shows the behavior of the fermentation processusing only water from cooling tower to chill thevat, where cell X, substrateS and ethanol E concentrationprofiles are <strong>de</strong>tailed. The fermentation temperatureprofile (T 21) is also presented. The final concentrationof ethanol in the simulated fermentation reaches114 / Vol. 13 (No. 3) Int. Centre for Applied Thermodynamics (ICAT)
10173.60 kg m −3 against a value of 73.41 kg m −3 obtainedin the industrial fermentation un<strong>de</strong>r analysis, representinga difference of 0.3%, and an ethanol fermentationefficiency of 88.4%.Consi<strong>de</strong>ring8hof process (fermentationtime plus wait time), the ethanol productivity is7.9kgm −3 h −1 . As seen from the figure, the fermentationtemperature reaches a maxim<strong>um</strong> of around 36 ◦ C.Thus, the use of water from the cooling tower as theonly cooling source is insufficient to keep the fermentationtemperature at the i<strong>de</strong>al value (32 ◦ C), which leadsto a lower efficiency.Figure 2. Ethanol E, substrate S and cell X concentrationprofiles for a fed-batch ethanol fermentation process usingonly the cooling tower to chill the vat.For the absorption <strong>chiller</strong> and cooling tower configuration,the mass flow rate of the absorption <strong>chiller</strong> (point18) is used to chill two fermentation vats and only halfof the mass flow rate from the cooling tower is used,because some of this stream is used in the absorption<strong>chiller</strong>. As seen from Figure 3, the fermentation temperature<strong>de</strong>creases by around 1 ◦ C with the absorption<strong>chiller</strong>/cooling tower and the final ethanol concentrationis 74.17 kg m −3 , increasing the ethanol concentration byaround 0.57 kg m −3 , which represents an annual ethanolincrease of approx. 240 m 3 per fermentation vat. Thefermentation efficiency of process is 89.2%and ethanolproductivity is 8.0kgm −3 h −1 ,consi<strong>de</strong>ring8hof fermentation.Figure 3. Fermentation temperature profiles T 21 using thecooling tower and the absorption <strong>chiller</strong>/cooling tower.With the cooling system shown in Figure 1, the coolingcapacity of the absorption <strong>chiller</strong> is not sufficientto remove all the heat released during the fermentation.The fermentation temperature T 21 continues tovary and differs greatly from the i<strong>de</strong>al temperature(32 ◦ C). A simulation with the fermentation temperaturekept constant at 32 ◦ C during the whole process wasperformed, and the final ethanol concentration reached75.37 kg m −3 , representing an annual ethanol increase ofaround 770 m 3 per fermentation vat. In this case, thefermentation efficiency and the ethanol productivity are90.9% and 8.1kgm −3 h −1 , respectively. The fermentationefficiency increased 2.5% in comparison with thatof the refrigeration system with only the cooling tower.Thus, keeping the temperature at the i<strong>de</strong>al value canreadily give several improvements in the process in termsof fermentation efficiency, productivity and cell viability.At high temperatures, the specific growth rate of contaminantmicroorganisms is increased, thus increasingthe <strong>de</strong>gree of contamination in the process. This contaminationcauses flocculation of the yeast cells, leadingto problems in the centrifugation and incurring highcosts for antibiotics. The high ethanol concentrationcombined with the high temperatures submits the cellsto stress conditions. Un<strong>de</strong>r these conditions the yeasthas a higher ten<strong>de</strong>ncy to produce glycerol, which is themain by-product of ethanol fermentation. Thus, lowertemperatures reduce the glycerol production, increasingthe process efficiency.Working with a lower fermentation temperature, theinlet substrate concentration S in of the vat can be increasedwithout adversely affect the fermentation process.Thus, on increasing the inlet substrate concentration,the production of ethanol in the fermentation vatincreases and a wine with a higher ethanol concentrationis passed to the distillery, producing a smaller amountof vinasse and requiring a lower thermal load (Camargoet al. 1990). The optimization of the fermentation processto increase the ethanol productivity, maintain cellviability and <strong>de</strong>crease the fermentation time, is nee<strong>de</strong>dwhen a higher inlet substrate concentration is used.The heat flow released during the fermentation ˙Q fand the heat flow of the fermentation heat exchanger˙Q fhx with the absorption <strong>chiller</strong>/cooling tower are shownin Figure 4. As seen from the figure, the heat flow offermentation is greater than the heat flow of the heatexchanger, thus the fermentation temperature increasesduring the process. The i<strong>de</strong>al process would be whenthe heat flow released and the heat flow of the heat exchangerare the same. This can be achieved by controllingthe fermentation temperature using the chilledwater flow valve as the manipulated variable or usingcold water with a high mass flow rate to maintain thei<strong>de</strong>al temperature.Pressures profile of the absorption <strong>chiller</strong> internalflows is presented in Figure 5. High and low pressuresincrease slightly because of the temperature variation ofcooling tower outlet, thereby internal temperatures arealso affected, as shown in Figure 6. Chiller’s COP variationsduring the fermentation process are negligible,holding close to 0.81.The lithi<strong>um</strong> bromi<strong>de</strong> concentrations of the weak solutionξ 3 and the strong solution ξ 4 are shown in Figure7. The concentrations and the concentration differ-Int. J. of Thermodynamics (IJoT) Vol. 13 (No. 3) / 115
- Page 1:
UNIVERSIDADE FEDERAL DE SANTA CATAR
- Page 4 and 5:
Catalogação na fonte pela Bibliot
- Page 7:
A toda minha família e amigos. . .
- Page 11:
Quem, de três milênios,Não é ca
- Page 15:
ABSTRACTEthanol fermentation is an
- Page 18 and 19:
Figura 20 Sistema de resfriamento d
- Page 20 and 21:
Figura 59 Diagrama de Dühring do r
- Page 23 and 24:
LISTA DE SÍMBOLOSSímbolos GeraisA
- Page 25:
SsttrvXwwbwkSubstratoForteTorre de
- Page 28 and 29:
4.3.7 Bomba de Solução . . . . .
- Page 30 and 31:
2A relação entre a energia renov
- Page 32 and 33:
4energia disponíveis no setor sucr
- Page 34 and 35:
6Cana de AçúcarRecepçãoCana de
- Page 36 and 37:
8A levedura é um microorganismo te
- Page 38 and 39:
10(a) Variação diária da tempera
- Page 40 and 41:
12efeitos, obtendo-se então os vap
- Page 42 and 43:
142.2 REFRIGERAÇÃO POR ABSORÇÃO
- Page 44 and 45:
16sorção intermitente, onde exist
- Page 46 and 47:
18Tabela 1 - Volume específico dos
- Page 48 and 49:
20segue,COP ca =COP =˙Q e˙Q g(2.4
- Page 50 and 51:
22Figura 14 - Diagrama de Dühring
- Page 52 and 53:
242.2.4 RESFRIADORES DE ABSORÇÃO
- Page 54 and 55:
26Figura 17 - Resfriador de absorç
- Page 56 and 57:
28em etanol foram encontrados para
- Page 58 and 59:
303.4 RESFRIADOR DE ABSORÇÃOSiste
- Page 60 and 61:
32ses como Japão, China e Coréia
- Page 63 and 64:
354 MODELAGEM MATEMÁTICA4.1 FERMEN
- Page 65 and 66:
37Tabela 5 - Dados fermentativos co
- Page 67 and 68:
39onde t é o tempo final do proces
- Page 69 and 70:
41onde a relação ω é expressa p
- Page 71 and 72:
43Tabela 8 - Dados de entrada da si
- Page 73 and 74:
45como segue,Cp g M gdT gdt= ∑ i(
- Page 75 and 76:
47O balanço de massa é expresso p
- Page 77 and 78: 49ção,(T 14 = T 13 + (T a − T 1
- Page 79: 51pode ocorrer o fenômeno da crist
- Page 82 and 83: 54Definição dos parâmetrosde ent
- Page 84 and 85: 56Figura 29 - Sistema de refrigera
- Page 86 and 87: 58Figura 31 - Efeito de uma queda a
- Page 88 and 89: 60Figura 34 - Efeito da variação
- Page 90 and 91: 62Figura 37 - Efeito de um aumento
- Page 92 and 93: 64Figura 40 - Influência da temper
- Page 94 and 95: 66Na Figura 43, é apresentada a cu
- Page 96 and 97: 68Figura 45 - Taxas de transferênc
- Page 98 and 99: 70Figura 47 - Perfis de concentraç
- Page 100 and 101: 72do ponto de cristalização ξ cr
- Page 102 and 103: 74A diferença entre a temperatura
- Page 104 and 105: 76Figura 54 - Eficiência da fermen
- Page 106 and 107: 78Figura 57 - Perfis de concentraç
- Page 108 and 109: 80Tabela 12 - Resultados do process
- Page 110 and 111: 82tando em uma redução de tempera
- Page 113 and 114: 85REFERÊNCIAS BIBLIOGRÁFICASALBER
- Page 115 and 116: 87DIAS, M. O. S.; FILHO, R. M.; ROS
- Page 117: 89SÁNCHEZ, S.; BRAVO, V.; MOYA, A.
- Page 120 and 121: 922001). Os parâmetros da Equaçã
- Page 122 and 123: 94−Temperatura do refrigerante: (
- Page 124 and 125: 96Figura 63 - Calor específico da
- Page 126 and 127: 98Figure 1. Schematic diagram of th
- Page 130 and 131: 102of the crystallization phenomeno
- Page 132: 104Camargo, C. A., Ushima, A. H., R


