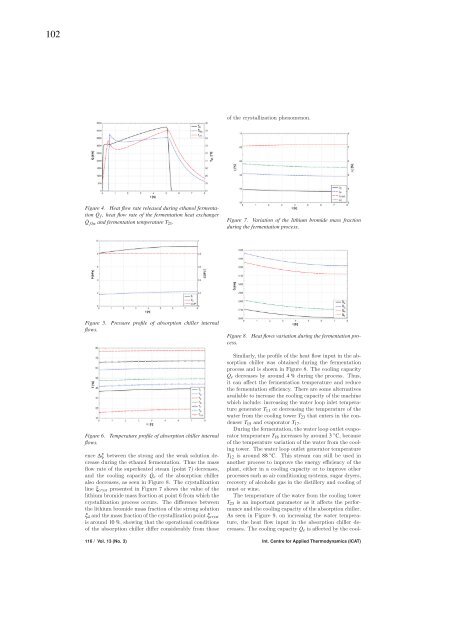
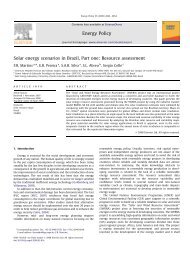
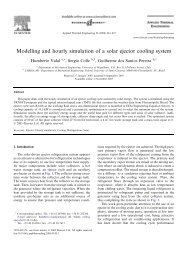
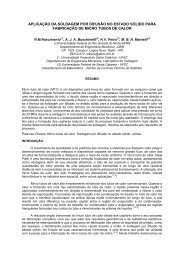
102of the crystallization phenomenon.Figure 4. Heat flow rate released during ethanol fermentation˙Q f , heat flow rate of the fermentation heat exchanger˙Q fhx and fermentation temperature T 21.Figure 7. Variation of the lithi<strong>um</strong> bromi<strong>de</strong> mass fractionduring the fermentation process.Figure 5.flows.Pressure profile of absorption <strong>chiller</strong> internalHeat flows variation during the fermentation pro-Figure 8.cess.Similarly, the profile of the heat flow input in the absorption<strong>chiller</strong> was obtained during the fermentationprocess and is shown in Figure 8. The cooling capacity˙Q e <strong>de</strong>creases by around 4% during the process. Thus,itcanaffectthefermentationtemperatureandreducethe fermentation efficiency. There are some alternativesavailable to increase the cooling capacity of the machinewhich inclu<strong>de</strong>: increasing the water loop inlet temperaturegenerator T 11 or <strong>de</strong>creasing the temperature of thewater from the cooling tower T 23 that enters in the con<strong>de</strong>nserT 15 and evaporator T 17.During the fermentation, the water loop outlet evaporatorFigure 6. Temperature profile of absorption <strong>chiller</strong> internaltemperature T 18 increases by around 3 ◦ C,becauseflows.of the temperature variation of the water from the coolingtower. The water loop outlet generator temperatureence Δξ between the strong and the weak solution <strong>de</strong>creaseduring the ethanol fermentation. Thus the massflow rate of the superheated steam (point 7) <strong>de</strong>creases,and the cooling capacity ˙Q e of the absorption <strong>chiller</strong>also <strong>de</strong>creases, as seen in Figure 8. The crystallizationline ξ cryst presented in Figure 7 shows the value of thelithi<strong>um</strong> bromi<strong>de</strong> mass fraction at point 6 from which thecrystallization process occurs. The difference betweenthe lithi<strong>um</strong> bromi<strong>de</strong> mass fraction of the strong solutionξ 4 and the mass fraction of the crystallization point ξ crystis around 10 %, showing that the operational conditionsof the absorption <strong>chiller</strong> differ consi<strong>de</strong>rably from thoseT 12 is around 88 ◦ C. This stream can still be used inanother process to improve the energy efficiency of theplant, either in a cooling capacity or to improve otherprocesses such as air conditioning systems, sugar dryers,recovery of alcoholic gas in the distillery and cooling ofmust or wine.The temperature of the water from the cooling towerT 23 is an important parameter as it affects the performanceand the cooling capacity of the absorption <strong>chiller</strong>.As seen in Figure 9, on increasing the water temperature,the heat flow input in the absorption <strong>chiller</strong> <strong>de</strong>creases.The cooling capacity ˙Q e is affected by the cool-116 / Vol. 13 (No. 3) Int. Centre for Applied Thermodynamics (ICAT)
103ing tower and it is essential to keep the water temperatureas low as possible. For each 1 ◦ C increase in thetemperature of the water from the cooling tower, thecooling capacity of the absorption <strong>chiller</strong> <strong>de</strong>creases byaround 35 kW, which is the cause of the reduction inthe cooling capacity shown in Figure 8.Figure 9. Heat flow input to the absorption <strong>chiller</strong> with thevariation in the temperature of the water from the coolingtower.process4 ConclusionsThe introduction of an absorption <strong>chiller</strong> in theethanol fermentation cooling system has been investigatedin this paper. A dynamic mo<strong>de</strong>l for the fed-batchfermentation process coupled with a quasi-steady statemo<strong>de</strong>l for the absorption system was <strong>de</strong>veloped un<strong>de</strong>rindustrial conditions.The simulation with the new configuration of the refrigerationsystem (absorption <strong>chiller</strong> and cooling tower)showed that it is possible to reduce the fermentationtemperature by around 1 ◦ C and increase the fermentationefficiency by around 0.8%, representing an annualethanol increase of around 240 m 3 per fermentation vat.These results can be improved by <strong>de</strong>creasing the temperatureto an i<strong>de</strong>al value in terms of both fermentationkinetics and cell viability. To improve these results,a refrigeration machine with a higher cooling capacityshould be used, un<strong>de</strong>r controlled operating conditions.An increase in the ethanol concentration of the winecan reduce significantly the energy cons<strong>um</strong>ption in thedownstream processes, such as distillation and vinasseconcentration. The industrial losses, especially those relatedto contamination of the fermentation medi<strong>um</strong>, canbe minimized through a temperature control.The results of this study <strong>de</strong>monstrate the potentialapplication of the absorption <strong>chiller</strong> in the fermentationprocess. An absorption <strong>chiller</strong> powered by industrialwaste heat is an excellent energy saving option in a cogenerationsystem in a sugar and ethanol plant. Thismay also promote an increase in the energy balance ofthe ethanol production process, the value for which iscurrently around 8.5. All of these advantages contributealso to the competitiveness and sustainability of ethanolindustry.AcknowledgementsThe authors would like to acknowledge Usina CerradinhoAçúcar e Álcool S/A for making available thedata and the FINEP for the financial support ofthis study.NomenclatureCOP coefficient of performanceCp specific heat capacity, kJ kg −1 K −1E ethanol concentration, kg m −3h enthalpy, kJ kg −1K i substrate inhibition coefficient, m 3 kg −1K S substrate saturation constant, kg m −3M molecular mass, kg kmol −1ṁ mass flow rate, kg h −1m E ethanol production associated with growth,kg kg −1 h −1m X maintenance coefficient, kg kg −1 h −1n product inhibition powerP pressure, kPa˙Q heat flow, kWS substrate concentration, kg m −3t time, hT temperature, ◦ CUA overall thermal conductance, kW K −1V working vol<strong>um</strong>e, m 3˙V vol<strong>um</strong>e flow rate, m 3 h −1X cell concentration, kg m −3y mole fractionY yield factor, kg kg −1Ẇ power, kWGreek symbolsΔH S fermentation heat released, kJ kg −1Δt time difference, hη efficiency, %μ specific growth rate, h −1φ productivity, kg m −3 h −1ρ <strong>de</strong>nsity, kg m −3ξ lithi<strong>um</strong> bromi<strong>de</strong> mass fraction, %References:Albers, E., Larsson, C., Lidén, G., Niklasson, C., andGustafsson, L. (2002). Continuous estimation of productconcentration with calorimetry and gas analysisduring anaerobic fermentations of Saccharomyces cerevisiae.Thermochimica acta, 394:185–190.Aldiguier, A. S., Alfenore, S., Cameleyre, X., Goma, G.,Uribelarrea, J. L., Guillouet, S. E., and Molina-Jouve,C. (2004). Synergistic temperature and ethanol effect onSaccharomyces cerevisiae dynamic behaviour in ethanolbio-fuel production. Bioprocess and Biosytems Engineering,26(4):217–222.ASHRAE (2001). HVAC Fundamentals Handbook.American Society of Heating, Refrigerating and Air-Conditioning Engineers.Atala, D. I. P., Costa, A. C., Maciel, R., and Maugeri,F. (2001). Kinetics of ethanol fermentation with highbiomass concentration consi<strong>de</strong>ring the effect of temperature.Applied Biochemistry and Biotechnology, 91-93(1-9):353–365.Bejan, A. and Kraus, A. D. (2003). Heat Transfer Handbook.John Wiley and Sons, Inc.Int. J. of Thermodynamics (IJoT) Vol. 13 (No. 3) / 117
- Page 1:
UNIVERSIDADE FEDERAL DE SANTA CATAR
- Page 4 and 5:
Catalogação na fonte pela Bibliot
- Page 7:
A toda minha família e amigos. . .
- Page 11:
Quem, de três milênios,Não é ca
- Page 15:
ABSTRACTEthanol fermentation is an
- Page 18 and 19:
Figura 20 Sistema de resfriamento d
- Page 20 and 21:
Figura 59 Diagrama de Dühring do r
- Page 23 and 24:
LISTA DE SÍMBOLOSSímbolos GeraisA
- Page 25:
SsttrvXwwbwkSubstratoForteTorre de
- Page 28 and 29:
4.3.7 Bomba de Solução . . . . .
- Page 30 and 31:
2A relação entre a energia renov
- Page 32 and 33:
4energia disponíveis no setor sucr
- Page 34 and 35:
6Cana de AçúcarRecepçãoCana de
- Page 36 and 37:
8A levedura é um microorganismo te
- Page 38 and 39:
10(a) Variação diária da tempera
- Page 40 and 41:
12efeitos, obtendo-se então os vap
- Page 42 and 43:
142.2 REFRIGERAÇÃO POR ABSORÇÃO
- Page 44 and 45:
16sorção intermitente, onde exist
- Page 46 and 47:
18Tabela 1 - Volume específico dos
- Page 48 and 49:
20segue,COP ca =COP =˙Q e˙Q g(2.4
- Page 50 and 51:
22Figura 14 - Diagrama de Dühring
- Page 52 and 53:
242.2.4 RESFRIADORES DE ABSORÇÃO
- Page 54 and 55:
26Figura 17 - Resfriador de absorç
- Page 56 and 57:
28em etanol foram encontrados para
- Page 58 and 59:
303.4 RESFRIADOR DE ABSORÇÃOSiste
- Page 60 and 61:
32ses como Japão, China e Coréia
- Page 63 and 64:
354 MODELAGEM MATEMÁTICA4.1 FERMEN
- Page 65 and 66:
37Tabela 5 - Dados fermentativos co
- Page 67 and 68:
39onde t é o tempo final do proces
- Page 69 and 70:
41onde a relação ω é expressa p
- Page 71 and 72:
43Tabela 8 - Dados de entrada da si
- Page 73 and 74:
45como segue,Cp g M gdT gdt= ∑ i(
- Page 75 and 76:
47O balanço de massa é expresso p
- Page 77 and 78:
49ção,(T 14 = T 13 + (T a − T 1
- Page 79: 51pode ocorrer o fenômeno da crist
- Page 82 and 83: 54Definição dos parâmetrosde ent
- Page 84 and 85: 56Figura 29 - Sistema de refrigera
- Page 86 and 87: 58Figura 31 - Efeito de uma queda a
- Page 88 and 89: 60Figura 34 - Efeito da variação
- Page 90 and 91: 62Figura 37 - Efeito de um aumento
- Page 92 and 93: 64Figura 40 - Influência da temper
- Page 94 and 95: 66Na Figura 43, é apresentada a cu
- Page 96 and 97: 68Figura 45 - Taxas de transferênc
- Page 98 and 99: 70Figura 47 - Perfis de concentraç
- Page 100 and 101: 72do ponto de cristalização ξ cr
- Page 102 and 103: 74A diferença entre a temperatura
- Page 104 and 105: 76Figura 54 - Eficiência da fermen
- Page 106 and 107: 78Figura 57 - Perfis de concentraç
- Page 108 and 109: 80Tabela 12 - Resultados do process
- Page 110 and 111: 82tando em uma redução de tempera
- Page 113 and 114: 85REFERÊNCIAS BIBLIOGRÁFICASALBER
- Page 115 and 116: 87DIAS, M. O. S.; FILHO, R. M.; ROS
- Page 117: 89SÁNCHEZ, S.; BRAVO, V.; MOYA, A.
- Page 120 and 121: 922001). Os parâmetros da Equaçã
- Page 122 and 123: 94−Temperatura do refrigerante: (
- Page 124 and 125: 96Figura 63 - Calor específico da
- Page 126 and 127: 98Figure 1. Schematic diagram of th
- Page 128 and 129: 100inhibition coefficient, E max is
- Page 132: 104Camargo, C. A., Ushima, A. H., R