Forschungsbericht 2010 - 2011 - Hochschule Bremen
Forschungsbericht 2010 - 2011 - Hochschule Bremen
Forschungsbericht 2010 - 2011 - Hochschule Bremen

Erfolgreiche ePaper selbst erstellen
Machen Sie aus Ihren PDF Publikationen ein blätterbares Flipbook mit unserer einzigartigen Google optimierten e-Paper Software.
<strong>Forschungsbericht</strong> <strong>2010</strong> / <strong>2011</strong><br />
142<br />
where:<br />
Pr l - Prandtl number of the liquid-phase,<br />
lambda l - conductivity of the liquid-phase,<br />
lambda wall - conductivity of the internal-wall,<br />
Re - Reynolds number.<br />
The „forced convection coefficient“ is calculated for<br />
one phase fluid (saturated liquid point).<br />
To compare the outcomes two possible correlations<br />
were selected – Dittus-Boelter’s (13) and Sieder-<br />
Tate’s (14).<br />
valid for: 0,7 < Pr < 16700 and Re < 10000<br />
(eta was calculated for an average temperature of the<br />
fluid phase and eta s for the temperature of a saturated<br />
point).<br />
There is no likelihood that an analytical solution will be<br />
reached for the reason that the rate of heat transfer<br />
per unit area is unknown at the beginning. That is why<br />
the software „EES“ (Engineering Equation Solver) was<br />
employed to deal with the problem numerically.<br />
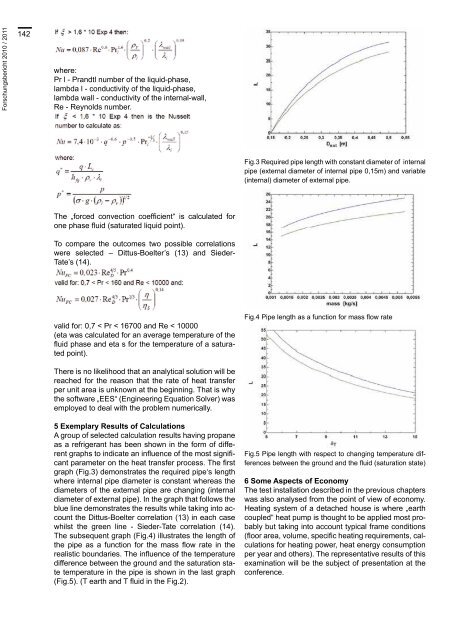
5 Exemplary Results of Calculations<br />
A group of selected calculation results having propane<br />
as a refrigerant has been shown in the form of different<br />
graphs to indicate an influence of the most significant<br />
parameter on the heat transfer process. The first<br />
graph (Fig.3) demonstrates the required pipe‘s length<br />
where internal pipe diameter is constant whereas the<br />
diameters of the external pipe are changing (internal<br />
diameter of external pipe). In the graph that follows the<br />
blue line demonstrates the results while taking into account<br />
the Dittus-Boelter correlation (13) in each case<br />
whilst the green line - Sieder-Tate correlation (14).<br />
The subsequent graph (Fig.4) illustrates the length of<br />
the pipe as a function for the mass flow rate in the<br />
realistic boundaries. The influence of the temperature<br />
difference between the ground and the saturation state<br />
temperature in the pipe is shown in the last graph<br />
(Fig.5). (T earth and T fluid in the Fig.2).<br />
Fig.3 Required pipe length with constant diameter of internal<br />
pipe (external diameter of internal pipe 0,15m) and variable<br />
(internal) diameter of external pipe.<br />
Fig.4 Pipe length as a function for mass flow rate<br />
Fig.5 Pipe length with respect to changing temperature differences<br />
between the ground and the fluid (saturation state)<br />
6 Some Aspects of Economy<br />
The test installation described in the previous chapters<br />
was also analysed from the point of view of economy.<br />
Heating system of a detached house is where „earth<br />
coupled“ heat pump is thought to be applied most probably<br />
but taking into account typical frame conditions<br />
(floor area, volume, specific heating requirements, calculations<br />
for heating power, heat energy consumption<br />
per year and others). The representative results of this<br />
examination will be the subject of presentation at the<br />
conference.