CRA Annual Report to Parliament 2011-2012 (PDF - Agence du ...
CRA Annual Report to Parliament 2011-2012 (PDF - Agence du ...
CRA Annual Report to Parliament 2011-2012 (PDF - Agence du ...

You also want an ePaper? Increase the reach of your titles
YUMPU automatically turns print PDFs into web optimized ePapers that Google loves.
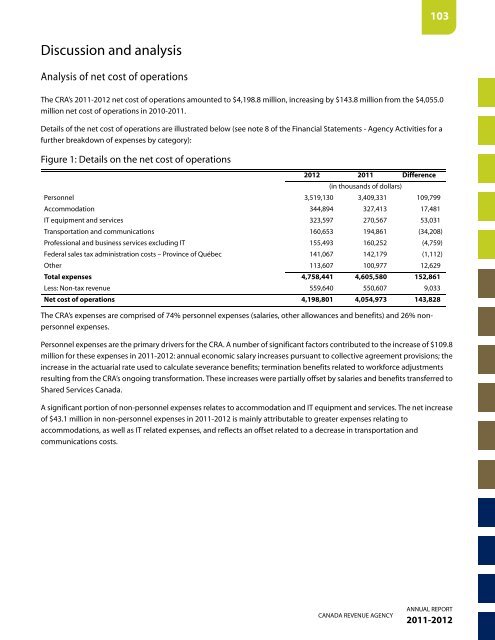
Discussion and analysis<br />
Analysis of net cost of operations<br />
The <strong>CRA</strong>’s <strong>2011</strong>-<strong>2012</strong> net cost of operations amounted <strong>to</strong> $4,198.8 million, increasing by $143.8 million from the $4,055.0<br />
million net cost of operations in 2010-<strong>2011</strong>.<br />
Details of the net cost of operations are illustrated below (see note 8 of the Financial Statements - Agency Activities for a<br />
further breakdown of expenses by category):<br />
Figure 1: Details on the net cost of operations<br />
<strong>2012</strong> <strong>2011</strong><br />
(in thousands of dollars)<br />
Difference<br />
Personnel 3,519,130 3,409,331 109,799<br />
Accommodation 344,894 327,413 17,481<br />
IT equipment and services 323,597 270,567 53,031<br />
Transportation and communications 160,653 194,861 (34,208)<br />
Professional and business services excluding IT 155,493 160,252 (4,759)<br />
Federal sales tax administration costs – Province of Québec 141,067 142,179 (1,112)<br />
Other 113,607 100,977 12,629<br />
Total expenses 4,758,441 4,605,580 152,861<br />
Less: Non-tax revenue 559,640 550,607 9,033<br />
Net cost of operations 4,198,801 4,054,973 143,828<br />
The <strong>CRA</strong>’s expenses are comprised of 74% personnel expenses (salaries, other allowances and benefits) and 26% nonpersonnel<br />
expenses.<br />
Personnel expenses are the primary drivers for the <strong>CRA</strong>. A number of significant fac<strong>to</strong>rs contributed <strong>to</strong> the increase of $109.8<br />
million for these expenses in <strong>2011</strong>-<strong>2012</strong>: annual economic salary increases pursuant <strong>to</strong> collective agreement provisions; the<br />
increase in the actuarial rate used <strong>to</strong> calculate severance benefits; termination benefits related <strong>to</strong> workforce adjustments<br />
resulting from the <strong>CRA</strong>’s ongoing transformation. These increases were partially offset by salaries and benefits transferred <strong>to</strong><br />
Shared Services Canada.<br />
A significant portion of non-personnel expenses relates <strong>to</strong> accommodation and IT equipment and services. The net increase<br />
of $43.1 million in non-personnel expenses in <strong>2011</strong>-<strong>2012</strong> is mainly attributable <strong>to</strong> greater expenses relating <strong>to</strong><br />
accommodations, as well as IT related expenses, and reflects an offset related <strong>to</strong> a decrease in transportation and<br />
communications costs.<br />
CANADA REVENUE AGENCY<br />
103<br />
ANNUAL REPORT<br />
<strong>2011</strong>-<strong>2012</strong>