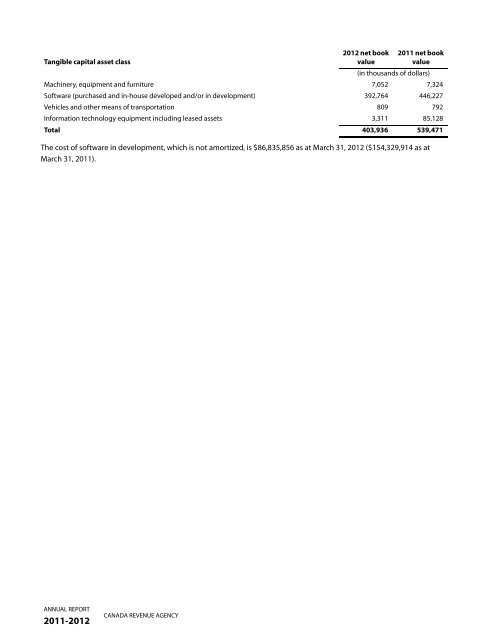
The cost of software in development, which is not amortized, is $86,835,856 as at March 31, <strong>2012</strong> ($154,329,914 as at March 31, <strong>2011</strong>). ANNUAL REPORT <strong>2011</strong>-<strong>2012</strong> CANADA REVENUE AGENCY <strong>2012</strong> net book value <strong>2011</strong> net book value Tangible capital asset class (in thousands of dollars) Machinery, equipment and furniture 7,052 7,324 Software (purchased and in-house developed and/or in development) 392,764 446,227 Vehicles and other means of transportation 809 792 Information technology equipment including leased assets 3,311 85,128 Total 403,936 539,471
8. Segmented information - Expenses The following table presents the expenses by program activity and expense category as described in note 1 of these financial statements. Assessment Accounts of returns Taxpayer receivable and and Internal <strong>Report</strong>ing and returns payment business Benefit Taxpayers’ services compliance compliance processing assistance Appeals programs Ombudsman <strong>2012</strong> <strong>2011</strong> Personnel: (in thousands of dollars) Salaries 549,676 682,962 408,867 318,327 226,219 92,037 80,281 1,671 2,360,040 2,331,814 Other allowances and benefits (including employee benefits described in note 5) 287,983 329,400 203,158 147,341 113,846 45,970 30,512 880 1,159,090 1,077,517 837,659 1,012,362 612,025 465,668 340,065 138,007 110,793 2,551 3,519,130 3,409,331 Accommodation 86,412 88,974 63,886 38,292 40,684 13,964 12,462 220 344,894 327,413 Professional and business services 124,699 16,509 17,880 3,783 5,194 86,601 1,141 67 255,874 204,313 Transportation and communications 53,512 19,739 14,284 51,297 3,729 1,102 16,924 66 160,653 194,861 Federal sales tax administration costs by the Province of Québec - - - 141,067 - - - - 141,067 142,179 Amortization of tangible capital assets (note 7) 38,308 11,813 13,817 23,199 2,908 1,214 3,511 - 94,770 94,564 Repair and maintenance 67,713 339 86 574 3 45 9 - 68,769 94,849 Equipment purchases 40,626 10,085 7,035 3,419 1,585 921 245 8 63,924 45,821 Other services and expenses 17,662 5,809 2,815 2,367 5,472 1,897 14,612 31 50,665 39,896 Materials and supplies 10,307 2,786 1,578 9,945 998 455 236 14 26,319 30,557 Loss on disposal/writeoff of tangible capital assets 7,679 105 10,903 1,070 162 - 10 - 19,929 6,699 Advertising, information and printing services 7,773 154 205 238 352 61 27 26 8,836 10,775 Equipment rentals 1,671 793 361 394 222 114 51 5 3,611 4,322 Total expenses 1,294,021 1,169,468 744,875 741,313 401,374 244,381 160,021 2,988 4,758,441 4,605,580 CANADA REVENUE AGENCY 95 ANNUAL REPORT <strong>2011</strong>-<strong>2012</strong>