CRA Annual Report to Parliament 2011-2012 (PDF - Agence du ...
CRA Annual Report to Parliament 2011-2012 (PDF - Agence du ...
CRA Annual Report to Parliament 2011-2012 (PDF - Agence du ...

Create successful ePaper yourself
Turn your PDF publications into a flip-book with our unique Google optimized e-Paper software.
Expenses (note 8)<br />
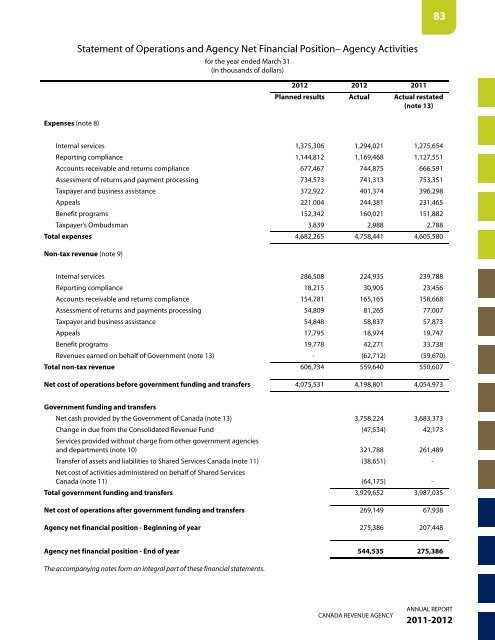
Statement of Operations and Agency Net Financial Position– Agency Activities<br />
for the year ended March 31<br />
(in thousands of dollars)<br />
CANADA REVENUE AGENCY<br />
83<br />
<strong>2012</strong> <strong>2012</strong> <strong>2011</strong><br />
Planned results Actual Actual restated<br />
(note 13)<br />
Internal services 1,375,306 1,294,021 1,275,654<br />
<strong>Report</strong>ing compliance 1,144,812 1,169,468 1,127,551<br />
Accounts receivable and returns compliance 677,467 744,875 666,591<br />
Assessment of returns and payment processing 734,573 741,313 753,351<br />
Taxpayer and business assistance 372,922 401,374 396,298<br />
Appeals 221,004 244,381 231,465<br />
Benefit programs 152,342 160,021 151,882<br />
Taxpayer’s Ombudsman 3,839 2,988 2,788<br />
Total expenses 4,682,265 4,758,441 4,605,580<br />
Non-tax revenue (note 9)<br />
Internal services 286,508 224,935 239,788<br />
<strong>Report</strong>ing compliance 18,215 30,905 23,456<br />
Accounts receivable and returns compliance 154,781 165,165 158,668<br />
Assessment of returns and payments processing 54,809 81,265 77,007<br />
Taxpayer and business assistance 54,848 58,837 57,873<br />
Appeals 17,795 18,974 19,747<br />
Benefit programs 19,778 42,271 33,738<br />
Revenues earned on behalf of Government (note 13) - (62,712) (59,670)<br />
Total non-tax revenue 606,734 559,640 550,607<br />
Net cost of operations before government funding and transfers 4,075,531 4,198,801 4,054,973<br />
Government funding and transfers<br />
Net cash provided by the Government of Canada (note 13) 3,758,224 3,683,373<br />
Change in <strong>du</strong>e from the Consolidated Revenue Fund (47,534) 42,173<br />
Services provided without charge from other government agencies<br />
and departments (note 10) 321,788 261,489<br />
Transfer of assets and liabilities <strong>to</strong> Shared Services Canada (note 11)<br />
Net cost of activities administered on behalf of Shared Services<br />
(38,651) -<br />
Canada (note 11) (64,175) -<br />
Total government funding and transfers 3,929,652 3,987,035<br />
Net cost of operations after government funding and transfers 269,149 67,938<br />
Agency net financial position - Beginning of year 275,386 207,448<br />
Agency net financial position - End of year 544,535 275,386<br />
The accompanying notes form an integral part of these financial statements.<br />
ANNUAL REPORT<br />
<strong>2011</strong>-<strong>2012</strong>