CRA Annual Report to Parliament 2011-2012 (PDF - Agence du ...
CRA Annual Report to Parliament 2011-2012 (PDF - Agence du ...
CRA Annual Report to Parliament 2011-2012 (PDF - Agence du ...

You also want an ePaper? Increase the reach of your titles
YUMPU automatically turns print PDFs into web optimized ePapers that Google loves.
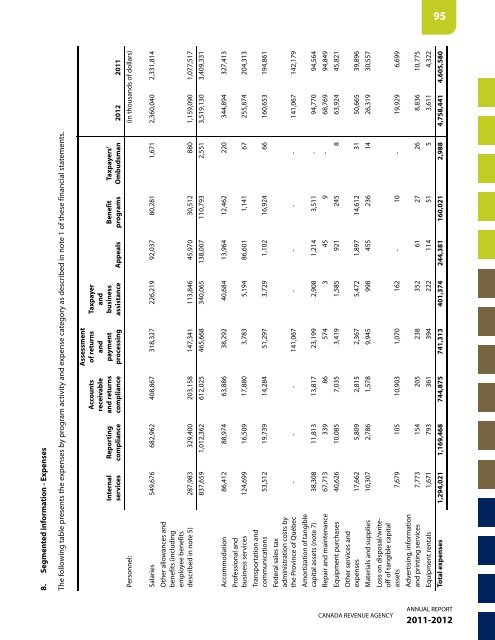
8. Segmented information - Expenses<br />
The following table presents the expenses by program activity and expense category as described in note 1 of these financial statements.<br />
Assessment<br />
Accounts of returns Taxpayer<br />
receivable and<br />
and<br />
Internal <strong>Report</strong>ing and returns payment business<br />
Benefit Taxpayers’<br />
services compliance compliance processing assistance Appeals programs Ombudsman <strong>2012</strong> <strong>2011</strong><br />
Personnel: (in thousands of dollars)<br />
Salaries 549,676 682,962 408,867 318,327 226,219 92,037 80,281 1,671 2,360,040 2,331,814<br />
Other allowances and<br />
benefits (including<br />
employee benefits<br />
described in note 5) 287,983 329,400 203,158 147,341 113,846 45,970 30,512 880 1,159,090 1,077,517<br />
837,659 1,012,362 612,025 465,668 340,065 138,007 110,793 2,551 3,519,130 3,409,331<br />
Accommodation 86,412 88,974 63,886 38,292 40,684 13,964 12,462 220 344,894 327,413<br />
Professional and<br />
business services 124,699 16,509 17,880 3,783 5,194 86,601 1,141 67 255,874 204,313<br />
Transportation and<br />
communications 53,512 19,739 14,284 51,297 3,729 1,102 16,924 66 160,653 194,861<br />
Federal sales tax<br />
administration costs by<br />
the Province of Québec - - - 141,067 - - - - 141,067 142,179<br />
Amortization of tangible<br />
capital assets (note 7) 38,308 11,813 13,817 23,199 2,908 1,214 3,511 - 94,770 94,564<br />
Repair and maintenance 67,713 339 86 574 3 45 9 - 68,769 94,849<br />
Equipment purchases 40,626 10,085 7,035 3,419 1,585 921 245 8 63,924 45,821<br />
Other services and<br />
expenses 17,662 5,809 2,815 2,367 5,472 1,897 14,612 31 50,665 39,896<br />
Materials and supplies 10,307 2,786 1,578 9,945 998 455 236 14 26,319 30,557<br />
Loss on disposal/writeoff<br />
of tangible capital<br />
assets 7,679 105 10,903 1,070 162 - 10 - 19,929 6,699<br />
Advertising, information<br />
and printing services 7,773 154 205 238 352 61 27 26 8,836 10,775<br />
Equipment rentals 1,671 793 361 394 222 114 51 5 3,611 4,322<br />
Total expenses 1,294,021 1,169,468 744,875 741,313 401,374 244,381 160,021 2,988 4,758,441 4,605,580<br />
CANADA REVENUE AGENCY<br />
95<br />
ANNUAL REPORT<br />
<strong>2011</strong>-<strong>2012</strong>