

Prudential Premier Retirement Variable Annuities
Prudential Premier Retirement Variable Annuities
Prudential Premier Retirement Variable Annuities

Create successful ePaper yourself
Turn your PDF publications into a flip-book with our unique Google optimized e-Paper software.
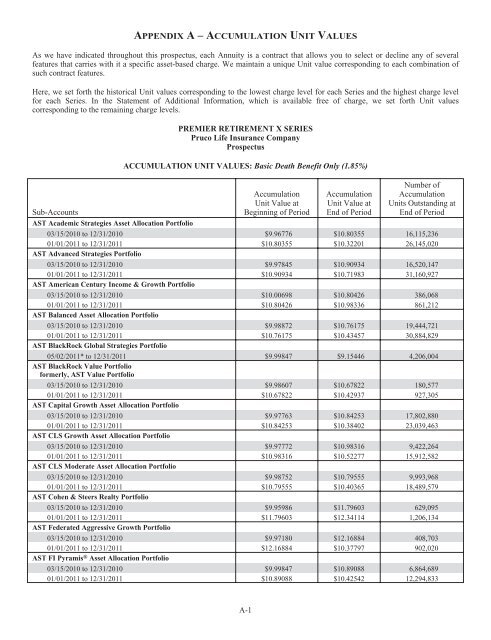
APPENDIX A–ACCUMULATION UNIT VALUES<br />
As we have indicated throughout this prospectus, each Annuity is a contract that allows you to select or decline any of several<br />
features that carries with it a specific asset-based charge. We maintain a unique Unit value corresponding to each combination of<br />
such contract features.<br />
Here, we set forth the historical Unit values corresponding to the lowest charge level for each Series and the highest charge level<br />
for each Series. In the Statement of Additional Information, which is available free of charge, we set forth Unit values<br />
corresponding to the remaining charge levels.<br />
Sub-Accounts<br />
PREMIER RETIREMENT X SERIES<br />
Pruco Life Insurance Company<br />
Prospectus<br />
ACCUMULATION UNIT VALUES: Basic Death Benefit Only (1.85%)<br />
Accumulation<br />
Unit Value at<br />
Beginning of Period<br />
Accumulation<br />
Unit Value at<br />
End of Period<br />
Number of<br />
Accumulation<br />
Units Outstanding at<br />
End of Period<br />
AST Academic Strategies Asset Allocation Portfolio<br />
03/15/2010 to 12/31/2010 $9.96776 $10.80355 16,115,236<br />
01/01/2011 to 12/31/2011 $10.80355 $10.32201 26,145,020<br />
AST Advanced Strategies Portfolio<br />
03/15/2010 to 12/31/2010 $9.97845 $10.90934 16,520,147<br />
01/01/2011 to 12/31/2011 $10.90934 $10.71983 31,160,927<br />
AST American Century Income & Growth Portfolio<br />
03/15/2010 to 12/31/2010 $10.00698 $10.80426 386,068<br />
01/01/2011 to 12/31/2011 $10.80426 $10.98336 861,212<br />
AST Balanced Asset Allocation Portfolio<br />
03/15/2010 to 12/31/2010 $9.98872 $10.76175 19,444,721<br />
01/01/2011 to 12/31/2011 $10.76175 $10.43457 30,884,829<br />
AST BlackRock Global Strategies Portfolio<br />
05/02/2011* to 12/31/2011 $9.99847 $9.15446 4,206,004<br />
AST BlackRock Value Portfolio<br />
formerly, AST Value Portfolio<br />
03/15/2010 to 12/31/2010 $9.98607 $10.67822 180,577<br />
01/01/2011 to 12/31/2011 $10.67822 $10.42937 927,305<br />
AST Capital Growth Asset Allocation Portfolio<br />
03/15/2010 to 12/31/2010 $9.97763 $10.84253 17,802,880<br />
01/01/2011 to 12/31/2011 $10.84253 $10.38402 23,039,463<br />
AST CLS Growth Asset Allocation Portfolio<br />
03/15/2010 to 12/31/2010 $9.97772 $10.98316 9,422,264<br />
01/01/2011 to 12/31/2011 $10.98316 $10.52277 15,912,582<br />
AST CLS Moderate Asset Allocation Portfolio<br />
03/15/2010 to 12/31/2010 $9.98752 $10.79555 9,993,968<br />
01/01/2011 to 12/31/2011 $10.79555 $10.40365 18,489,579<br />
AST Cohen & Steers Realty Portfolio<br />
03/15/2010 to 12/31/2010 $9.95986 $11.79603 629,095<br />
01/01/2011 to 12/31/2011 $11.79603 $12.34114 1,206,134<br />
AST Federated Aggressive Growth Portfolio<br />
03/15/2010 to 12/31/2010 $9.97180 $12.16884 408,703<br />
01/01/2011 to 12/31/2011 $12.16884 $10.37797 902,020<br />
AST FI Pyramis ® Asset Allocation Portfolio<br />
03/15/2010 to 12/31/2010 $9.99847 $10.89088 6,864,689<br />
01/01/2011 to 12/31/2011 $10.89088 $10.42542 12,294,833<br />
A-1


